
When Breakpoints Aren’t Enough: Debugging Faster with ULINKpro Trace
Most embedded developers are familiar with the usual debugging cycle: set a breakpoint, stop the processor, inspect the problem, make a change, and try again.
That works well until the problem depends on timing, interrupts, RTOS task interaction, DMA, communication traffic, or a failure that only occurs occasionally.
At that point, stopping the processor can sometimes hide the very problem you are trying to find.
This is where trace can make a significant difference.
See More Than the Current Breakpoint
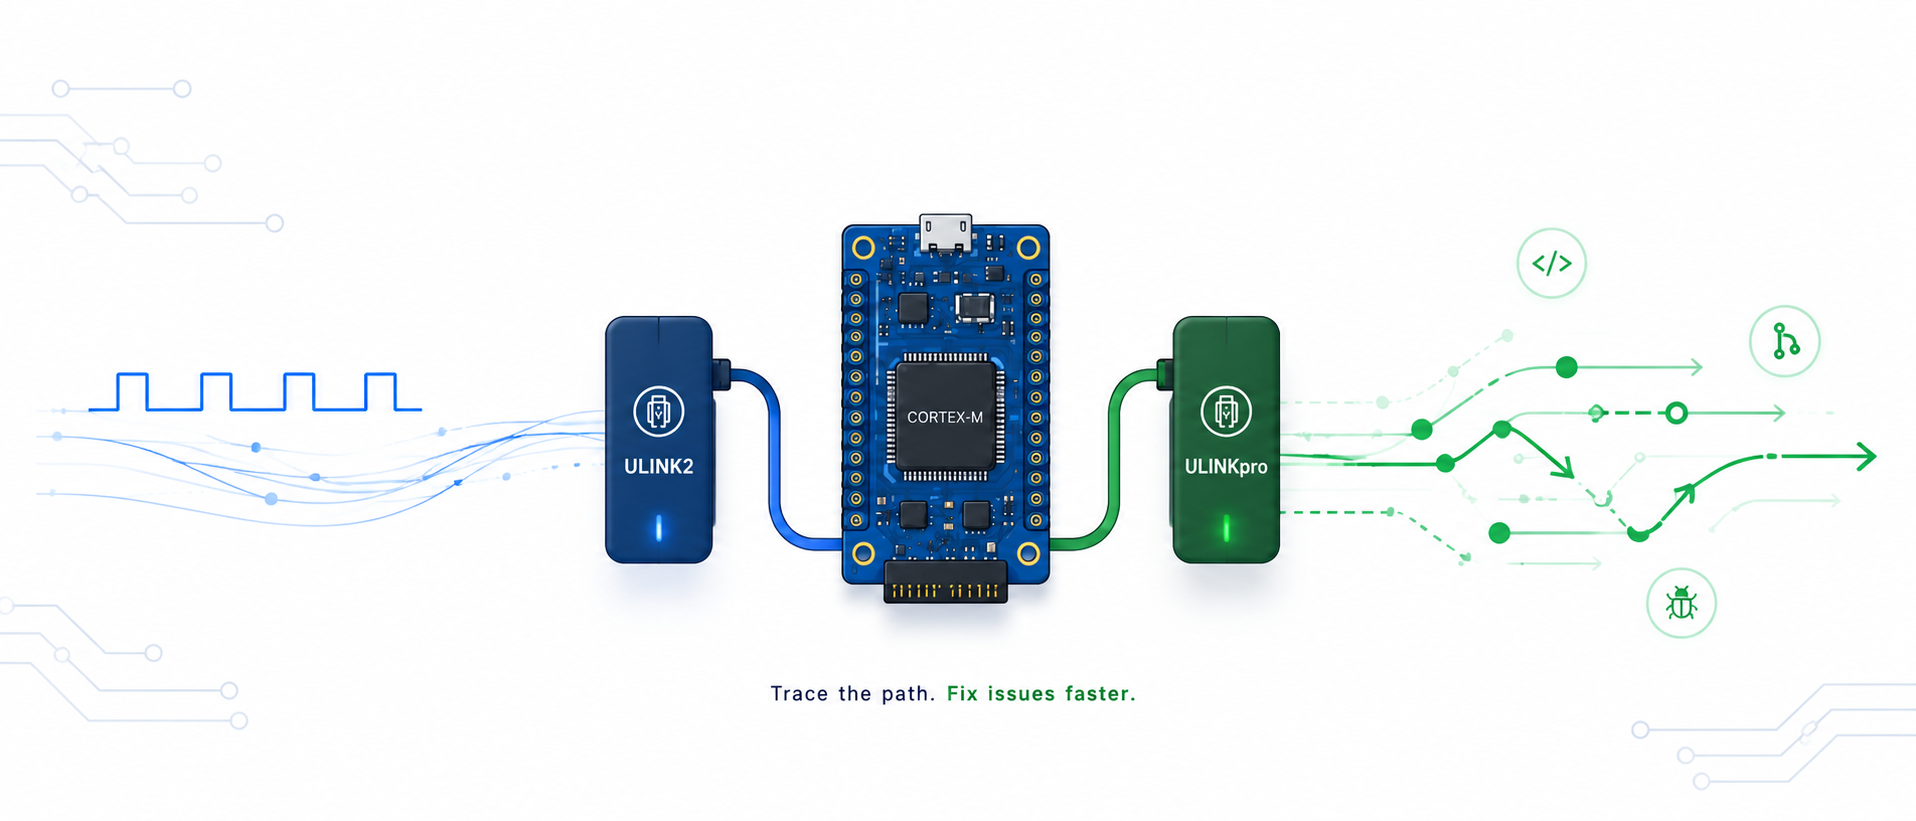
A standard debugger such as Keil ULINK2 provides SWD/JTAG debugging together with Serial Wire Viewer (SWV), giving developers useful runtime information such as events, exceptions, data activity and program-counter sampling.
But SWV is still only showing selected information about what happened.
With ULINKpro and ETM instruction trace, the debugger can capture the processor's actual execution history and reconstruct the instructions and code paths that were executed.
Instead of reaching a fault and asking:
“Why did my software end up here?”
you can trace backwards through the execution sequence that led to it.
For complex embedded systems, that difference can dramatically reduce the amount of trial-and-error debugging required.
Why ULINKpro?
ULINKpro combines traditional debugging with high-speed SWV and ETM instruction trace of up to 800 Mbit/s on supported Cortex-M devices. It can stream trace information directly to the host computer, allowing trace sessions to continue for minutes, hours, or longer rather than being limited to a small local trace buffer.
That gives engineering teams several practical advantages:
- Find intermittent faults faster by examining what happened before a crash or HardFault.
- Debug without constantly stopping the processor, helping preserve the timing of real-time applications.
- Follow complex execution paths across functions, interrupts and application logic.
- Identify performance bottlenecks using execution profiling.
- Generate code-coverage information to see which parts of the application actually executed during testing.
- Capture longer test scenarios using streaming trace rather than reproducing the issue repeatedly.
For example, a normal debugging session might tell you that the processor reached HardFault_Handler().
ETM trace can help reveal the sequence behind it:
Task → ProcessPacket() → Interrupt → Buffer Access → Invalid Pointer → HardFault
That additional context can turn hours of breakpoint placement and repeated testing into a much more focused root-cause investigation.
ULINK2 or ULINKpro?
For everyday firmware development, ULINK2 remains a capable debugger and provides SWV trace for runtime visibility.
ULINKpro becomes valuable when the application reaches the point where simply knowing the current state is no longer enough.
The difference is essentially:
ULINK2 helps you see what the system is doing.
ULINKpro can help you understand how the system got there.
And for RTOS applications, communication stacks, interrupt-heavy firmware and difficult timing-dependent failures, having that execution history can significantly shorten the path from “we reproduced the problem” to “we found the root cause.”
ETM trace does require support from the target processor and the appropriate trace connections on the hardware, but when those are available, ULINKpro adds a level of visibility that traditional stop-and-go debugging simply cannot provide.
RELATED NEWS
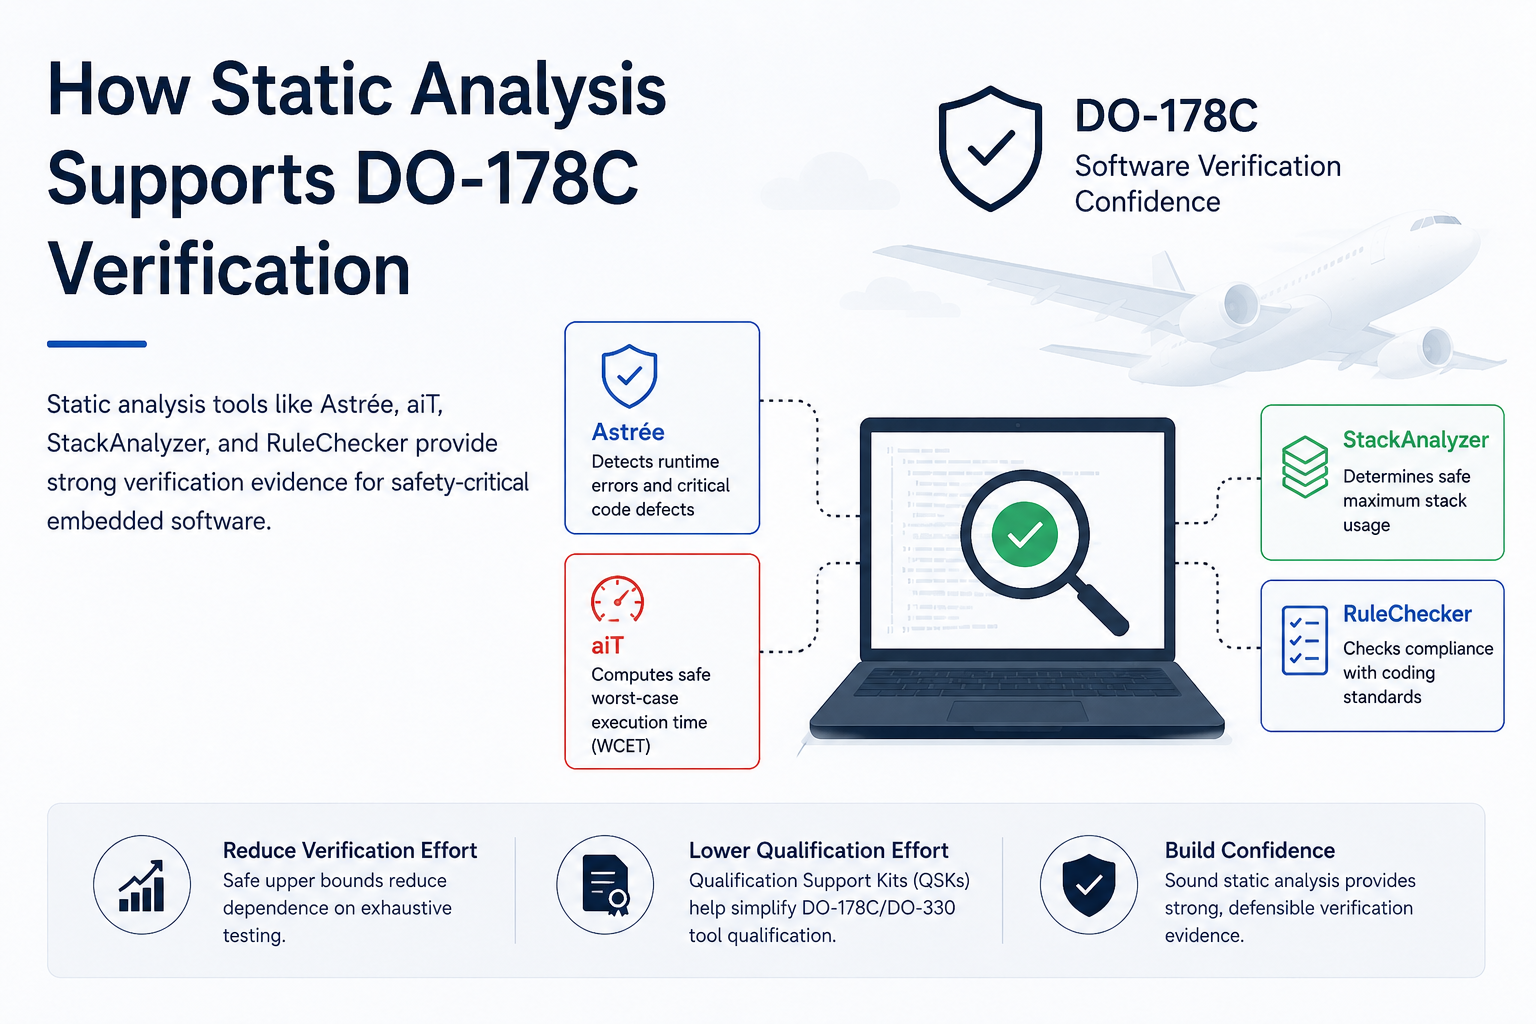
How Static Analysis Supports DO-178C Verification
Developing software for airborne systems requires strong verification evidence, especially for higher-criticality applications. DO-178C defines objectives for airborne software development and ve[...]
Read more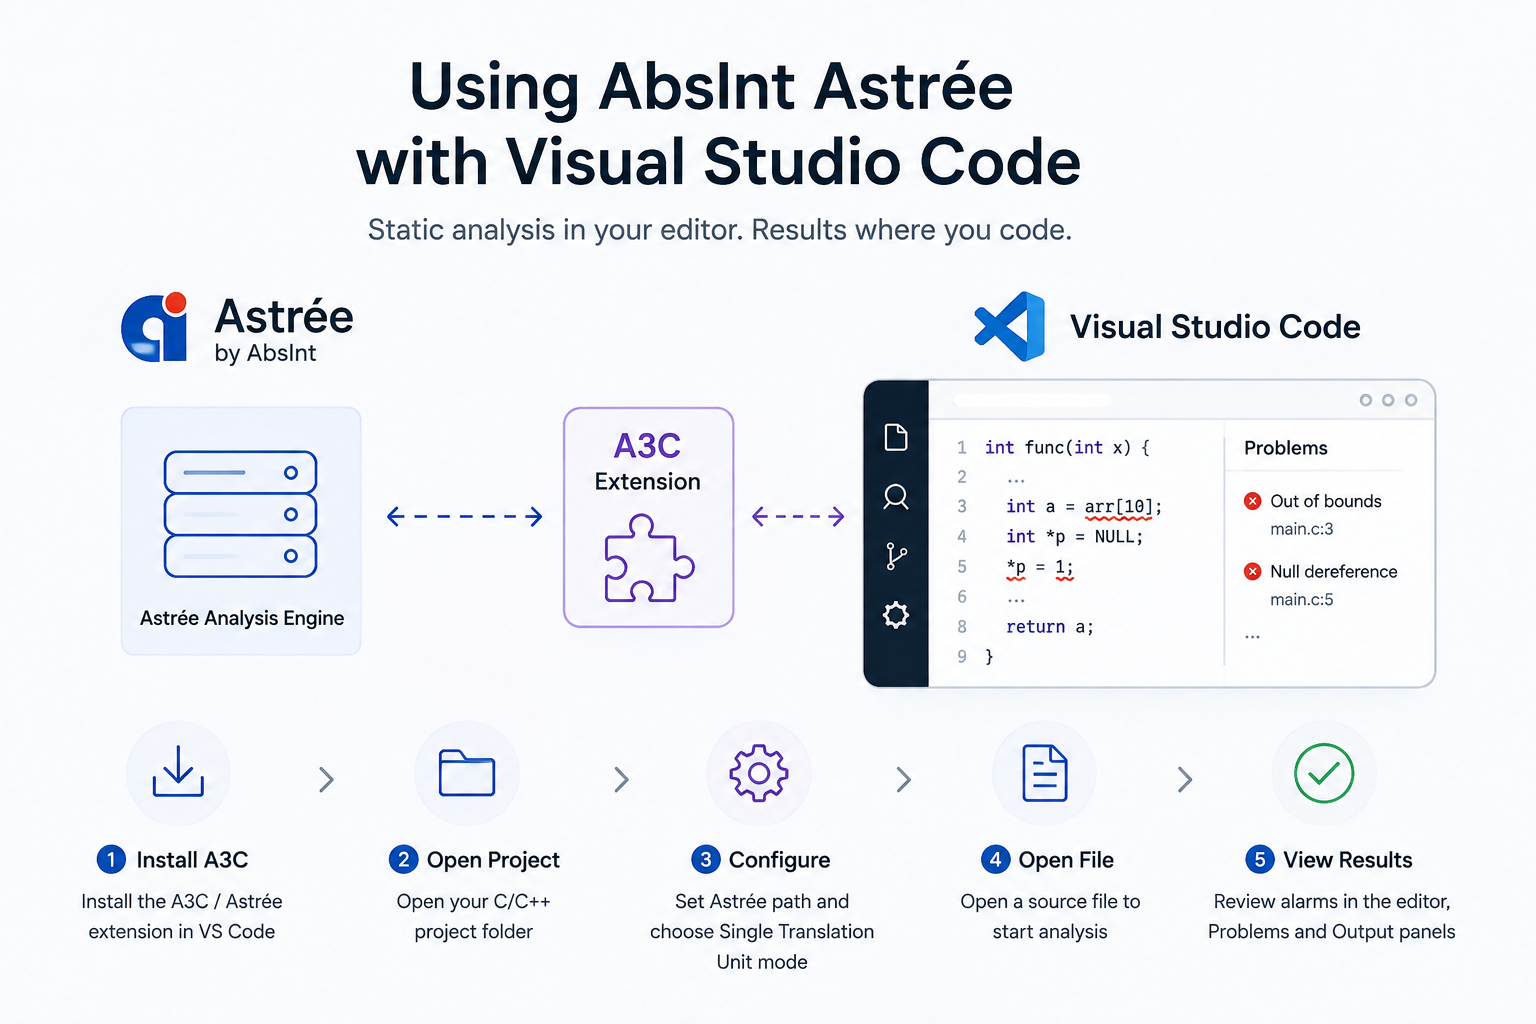
Installing and Using AbsInt Astrée with Visual Studio Code
AbsInt Astrée can be integrated with Visual Studio Code using the A3C extension, allowing developers to run Astrée analysis and review detected alarms directly within the editor. Install and Con[...]
Read more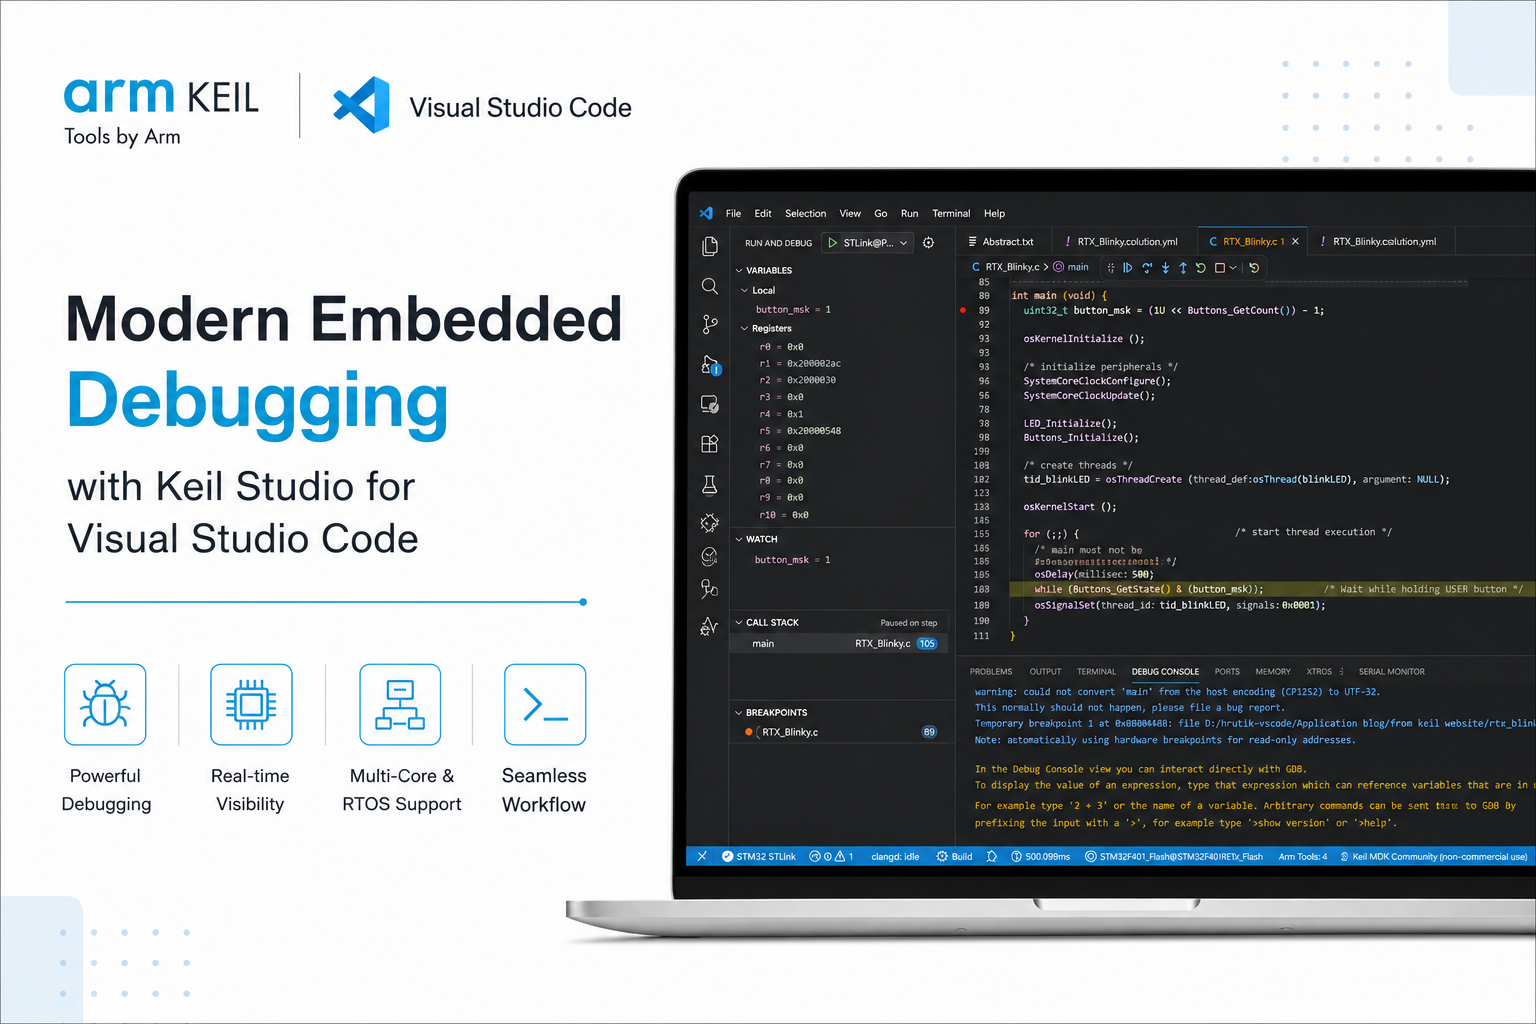
Modern Embedded Debugging with Keil Studio for Visual Studio Code
Visual Studio Code has rapidly become a preferred development environment for embedded software, and many engineering teams are now looking beyond editing and building firmware. The Arm Keil Stud[...]
Read more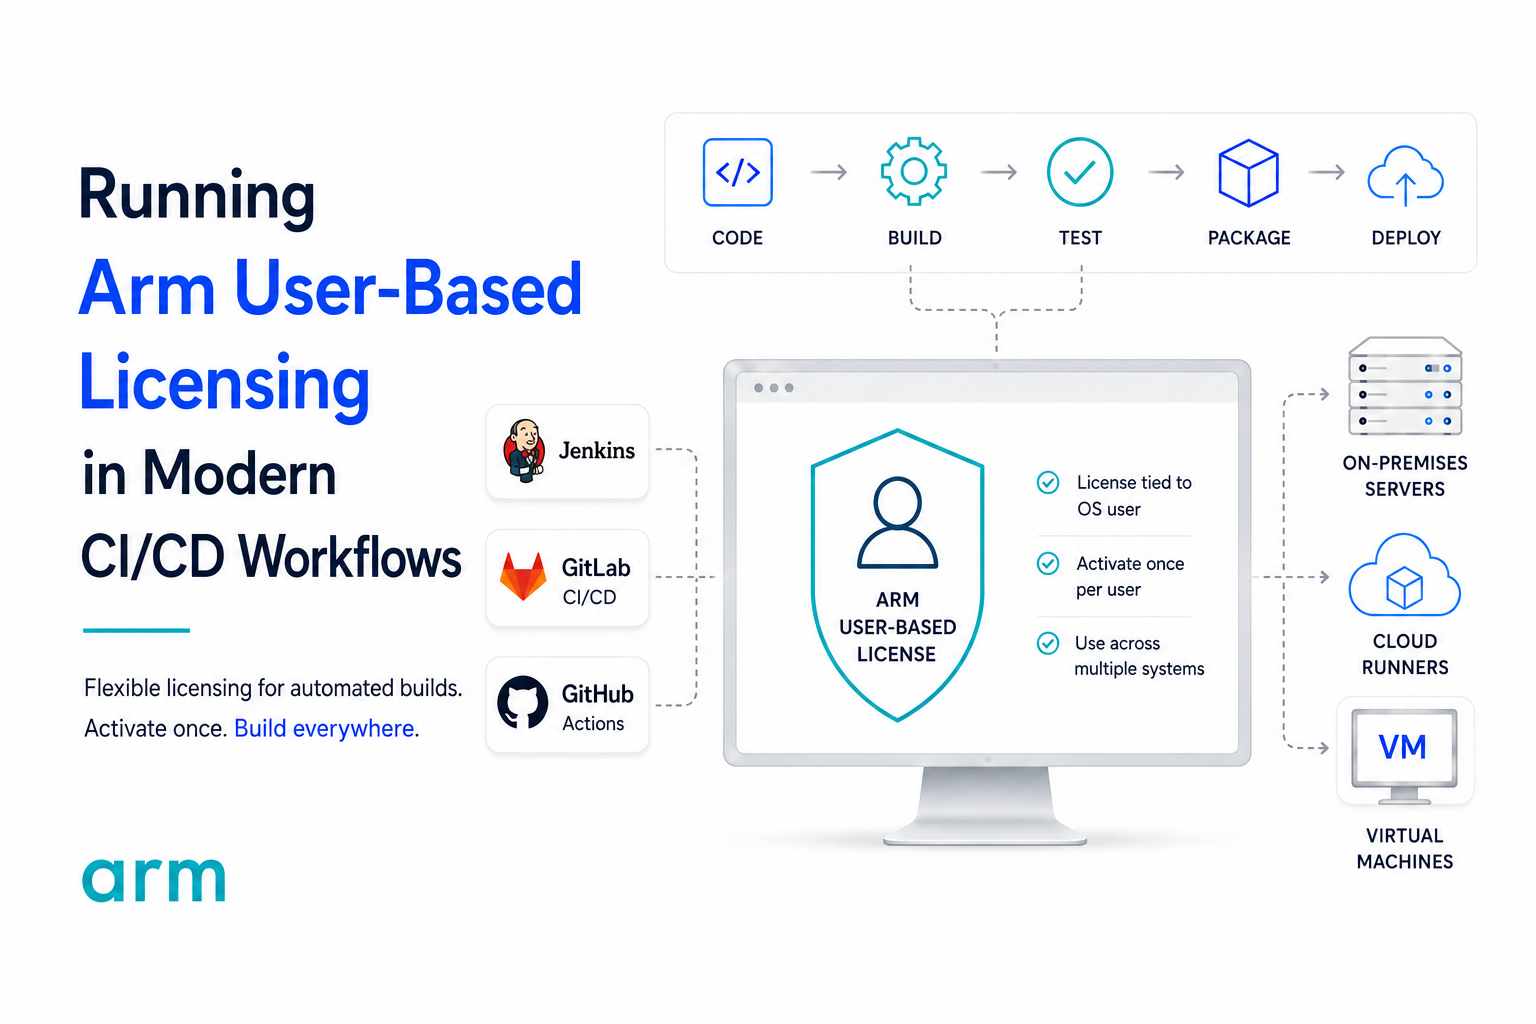
Running Arm User-Based Licensing in Modern CI/CD Workflows
Modern embedded software development no longer ends at a successful local build. Firmware is now continuously compiled, tested, analyzed, and packaged through automated pipelines running on Jenki[...]
Read more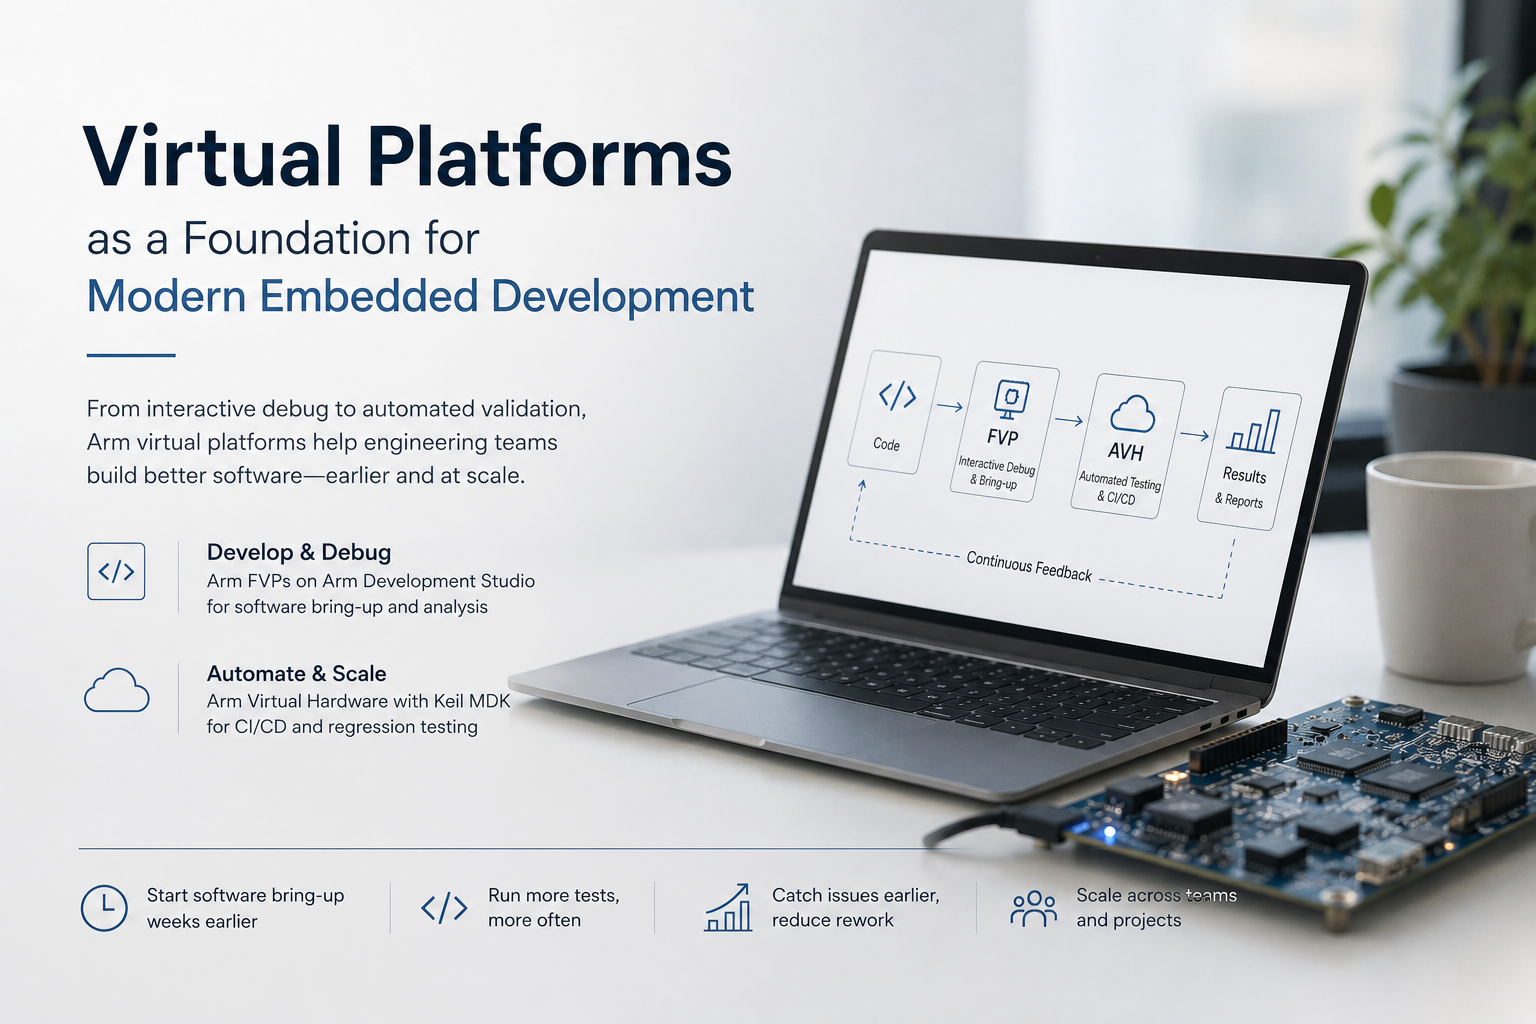
Virtual Platforms as a Foundation for Modern Embedded Development
Modern embedded software development is no longer limited to writing code and waiting for a physical target. As engineering teams adopt CI/CD pipelines, distributed development, and parallel hard[...]
Read more
EMBEDDED IS EVERYWHERE
PRODUCTS
Manufacturers
Resource center