
News
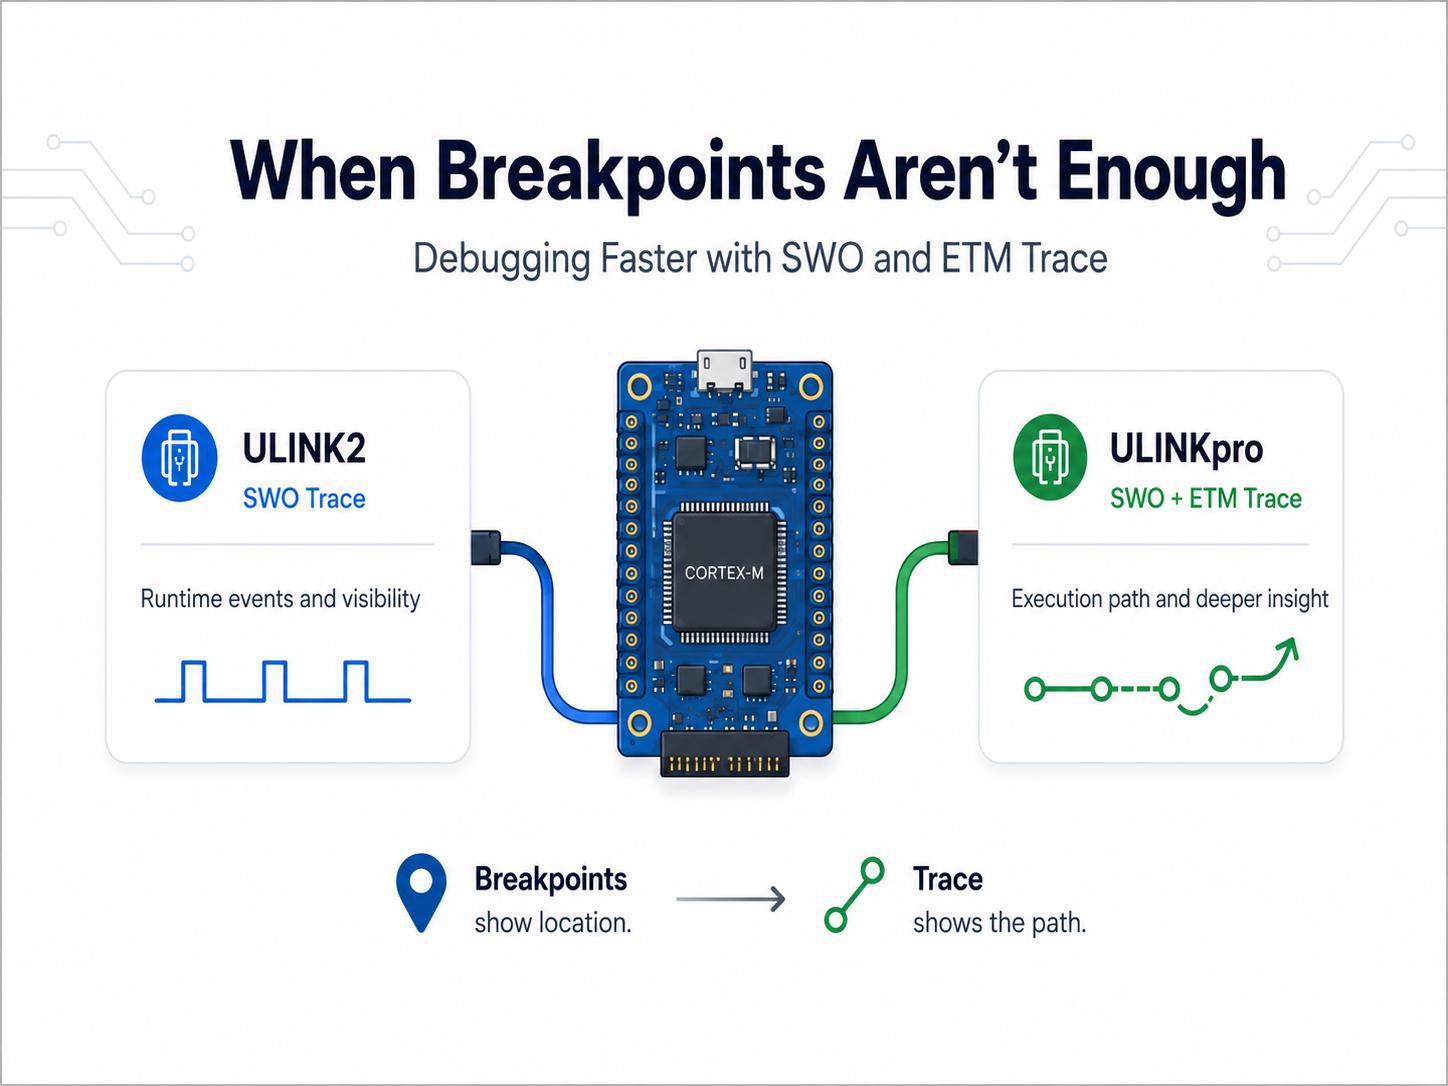
When Breakpoints Aren’t Enough: Debugging Faster with ULINKpro Trace
Most embedded developers are familiar with the usual debugging cycle: set a breakpoint, stop the processor, inspect the problem, make a change, and try again. That works well until the problem depends on timing, interrupts, RTOS task interaction, DMA, communication traffic, or a failure that only occurs occasionally. At that point, stopping the processor can sometimes hide the very problem you are trying to find. This is where trace can make a significant difference. See More Than the Current Breakpoint A debugger such as Keil ULINK2 provides SWD/JTAG debugging together with Serial Wire Viewer (SWV), giving developers runtime information such as events, exceptions, data activity, and program-counter sampling. But SWV is still only showing selected information about what happened. With ULINKpro and ETM instruction trace, the debugger can capture the processor's actual execution history and reconstruct the instructions and code paths that were executed. Instead of reaching a fault and asking: “Why did my software end up here?” you can trace backwards through the execution sequence that led to it. For complex embedded systems, that difference can dramatically reduce the amount of trial-and-error debugging required. Why ULINKpro? ULINKpro combines traditional debugging with high-speed SWV and ETM instruction trace of up to 800 Mbit/s on supported Cortex-M devices. It can also stream trace directly to the host computer, allowing much longer trace sessions. That gives engineering teams several practical advantages: Find intermittent faults faster by examining what happened before a crash or HardFault. Debug without constantly stopping the processor, helping preserve real-time behaviour. Follow complex execution paths across functions, interrupts and application logic. Identify performance bottlenecks using execution profiling. Generate code-coverage information during testing. Capture longer scenarios instead of repeatedly trying to reproduce the issue. For example, a normal debugging session might tell you that the processor reached HardFault_Handler(). ETM trace can help reveal the sequence behind it: Task → ProcessPacket() → Interrupt → Buffer Access → Invalid Pointer → HardFault That extra context can turn repeated breakpoint placement into a much more focused root-cause investigation. ULINK2 or ULINKpro? For everyday firmware development, ULINK2 remains a capable debugger and provides SWV trace for runtime visibility. ULINKpro becomes valuable when simply knowing the current state is no longer enough. ULINK2 helps you see what the system is doing. ULINKpro can help you understand how the system got there. For RTOS applications, communication stacks, interrupt-heavy firmware, and timing-dependent failures, that execution history can significantly shorten the path from “we reproduced the problem” to “we found the root cause.” ETM trace does require support from the target processor and the appropriate trace connections on the hardware, but when available, ULINKpro provides a level of visibility that traditional stop-and-go debugging cannot.
Learn more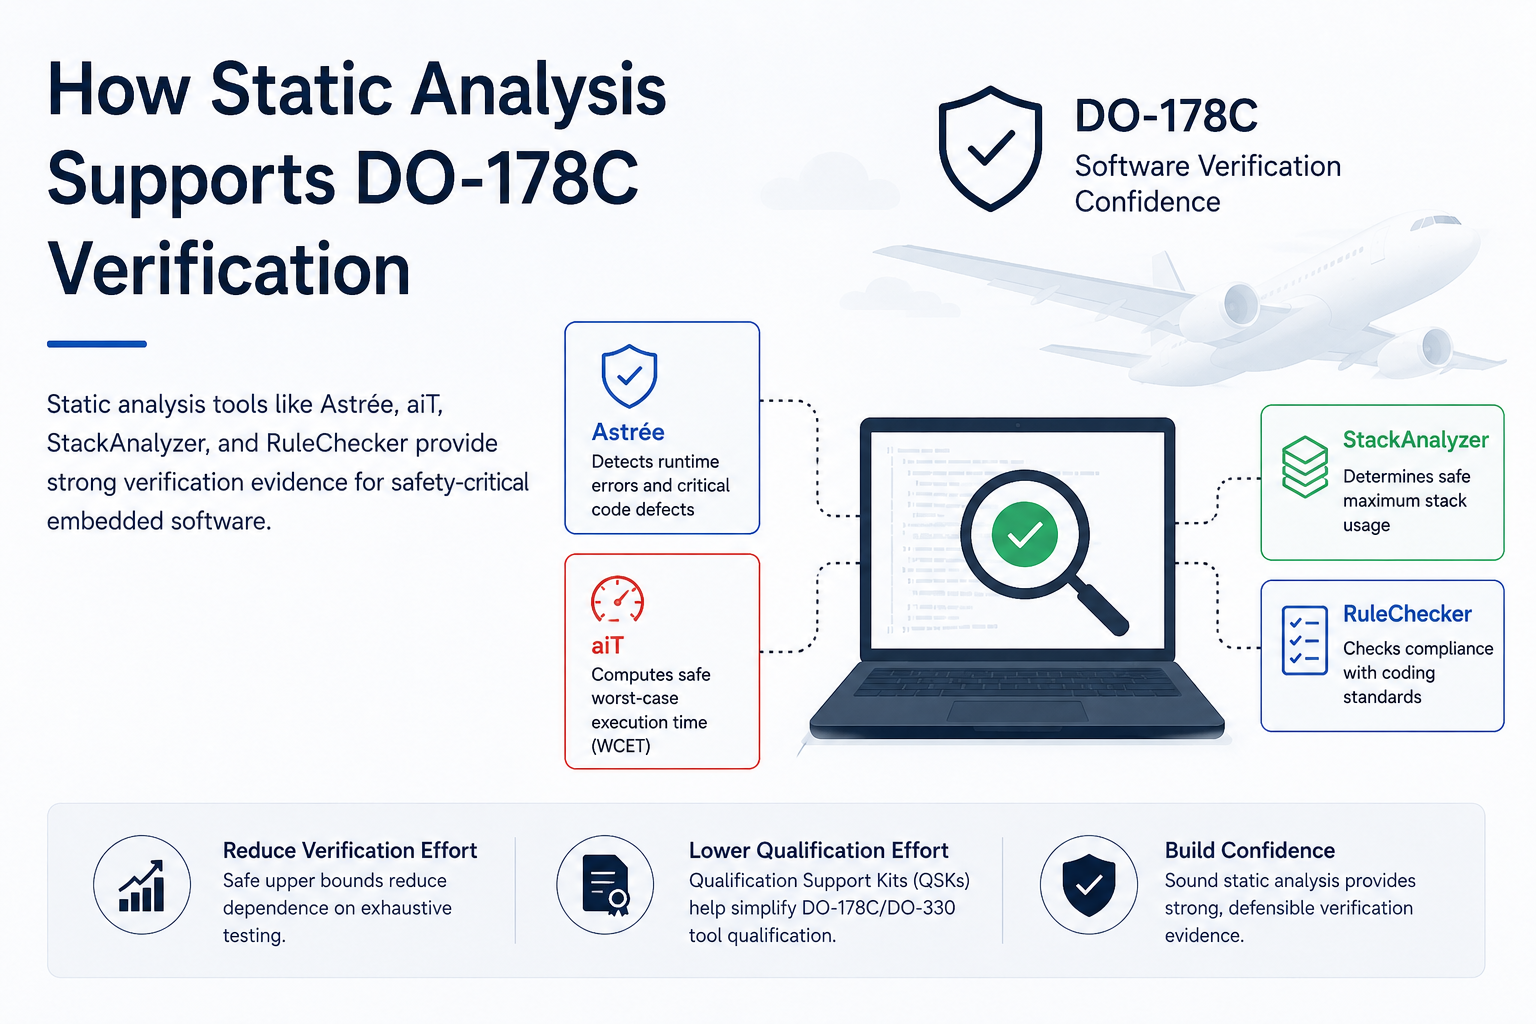
How Static Analysis Supports DO-178C Verification
Developing software for airborne systems requires strong verification evidence, especially for higher-criticality applications. DO-178C defines objectives for airborne software development and verification, while DO-333 provides guidance for using formal methods as part of that process. Static analysis tools such as Astrée, aiT, StackAnalyzer, and RuleChecker can support several of these verification activities and help reduce the amount of manual effort required during certification. Where Static Analysis Helps Testing is essential, but some properties are difficult to demonstrate through testing alone. For example, proving that all relevant program paths and hardware conditions have been exercised can require significant effort. Sound static analysis based on Abstract Interpretation takes a different approach. Instead of relying on individual test executions, it analyzes an approximation of all possible program behaviors while keeping the result on the safe side. DO-333 recognizes Abstract Interpretation as a formal method, and AbsInt maps its analysis tools to several DO-178C/DO-333 verification objectives. The tools address different areas of verification: Astrée detects potential runtime errors such as overflows, invalid pointers, uninitialized variables, array access errors, and data-flow issues. aiT determines safe upper bounds for Worst-Case Execution Time (WCET). StackAnalyzer determines safe upper bounds for maximum stack usage. RuleChecker checks compliance with coding guidelines such as MISRA and other supported standards. Together, these tools can provide verification evidence for runtime behavior, timing, memory usage, control/data flow, and coding-standard compliance. Where the ROI Comes From The ROI is mainly found in two areas. First, static analysis can reduce verification effort. Determining WCET or stack usage through measurement may require extensive target testing and confidence that the worst-case program and hardware conditions were actually observed. Sound static analysis provides safe upper bounds by design, reducing dependence on exhaustive testing. Second, there is tool qualification effort. When verification tools are used to reduce or replace manual verification activities, qualification requirements may apply under DO-178C/DO-330. AbsInt provides Qualification Support Kits for aiT, Astrée, and StackAnalyzer to support this process and reduce the amount of qualification material a development team must create themselves. Bringing Verification Earlier into Development Static analysis is most valuable when it is used throughout development rather than only at the end of the certification process. Running these analyses early can help identify runtime errors, timing violations, stack problems, and coding-standard issues before they become expensive integration or certification problems. For teams working toward DO-178C compliance, static analysis therefore provides more than defect detection. It can become part of the verification strategy itself helping improve confidence in the software while reducing verification and qualification effort. Want to learn how these tools fit into a practical DO-178C workflow? Join us at our upcoming in-person event to explore how static analysis can support safety-critical software development and verification.
Learn more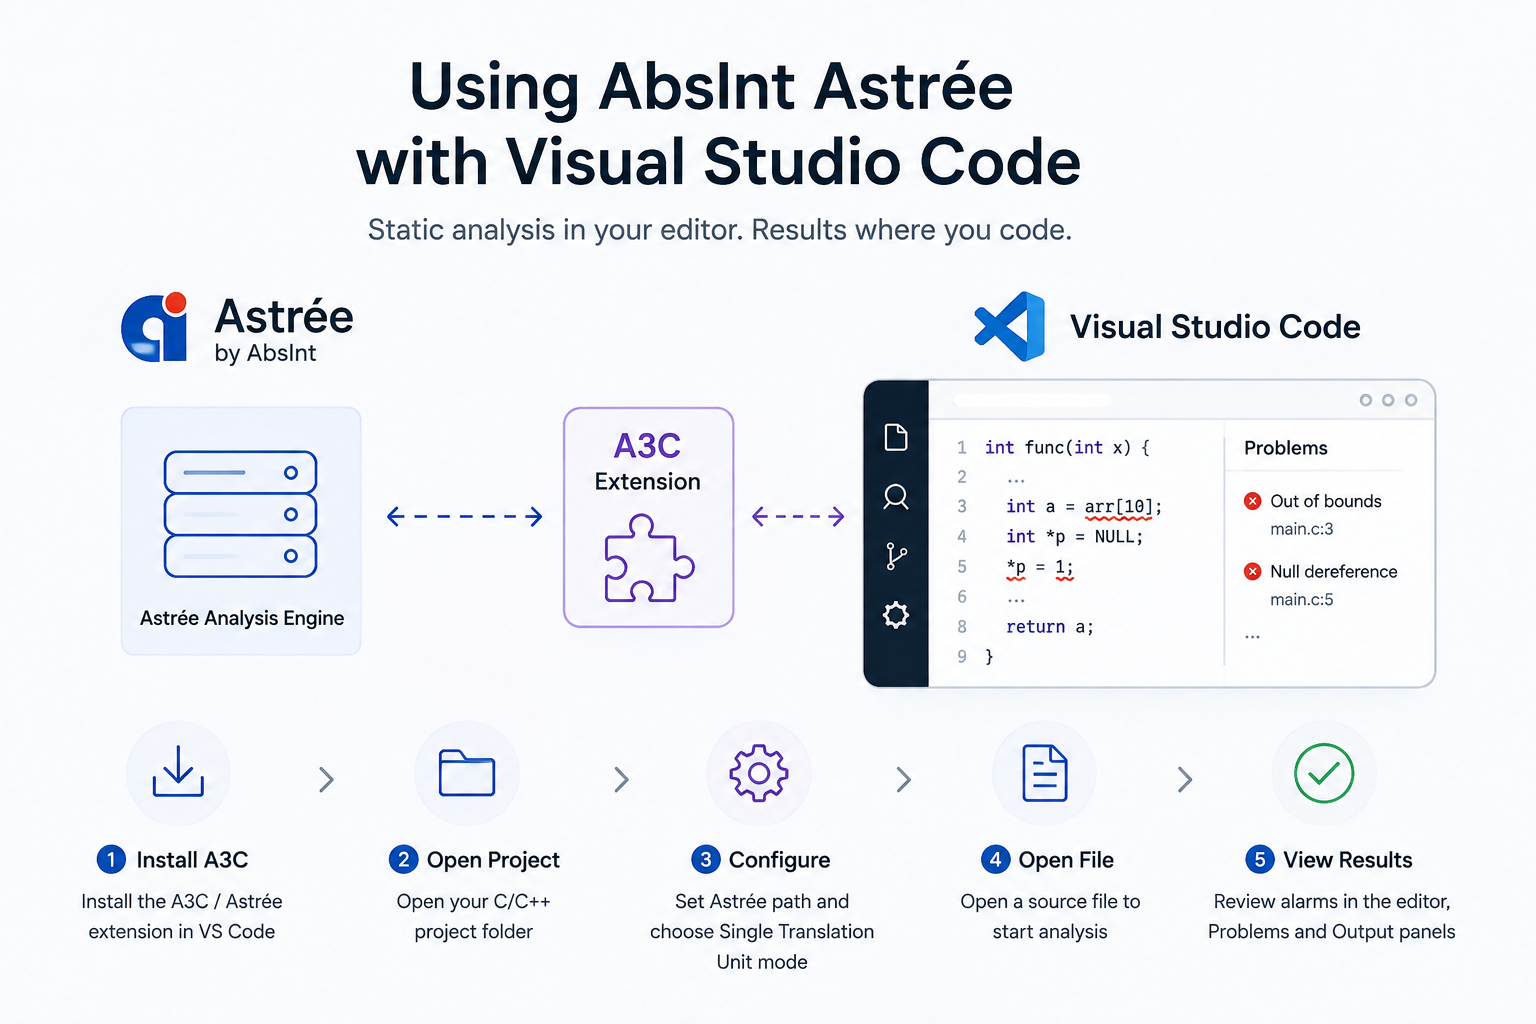
Installing and Using AbsInt Astrée with Visual Studio Code
AbsInt Astrée can be integrated with Visual Studio Code using the A3C extension, allowing developers to run Astrée analysis and review detected alarms directly within the editor. Install and Configure A3C Open Visual Studio Code and press Ctrl + Shift + X. Search for the A3C / Astrée extension and install it. Configure the Astrée installation path if prompted. Open your C/C++ project folder in VS Code. Once configured, A3C connects VS Code with Astrée and can automatically start an analysis when a source file is opened. Running the Analysis For Single Translation Unit analysis, go to: Manage → Settings → Workspace → Extensions → A3C for C/C++ LSP Client Change the view from Full Project to Single Translation Unit. Now, when you open a source file, Astrée automatically starts the analysis. Opening another source file triggers a new analysis for that file. Detected alarms appear directly in the editor as red squiggly indicators, with additional information available in the Problems and Output panels. A single-click analyzes a file temporarily, while a double-click keeps the results available, allowing alarms from multiple files to be reviewed together. You may also see a .dax file at the top level of an Astrée project: Project/├── project.dax└── src/ ├── main.c ├── module1.c └── module2.c The .dax file is not source code. It contains the Astrée project/analysis configuration and defines how Astrée should analyze the source code. This is why it is typically kept at the project level rather than inside the source directory. See It in Action The complete workflow is also demonstrated at approximately the 26-minute mark of our webinar: Integrating AbsInt Static Analysis Tool with the KEIL Studio and using VS code
Learn more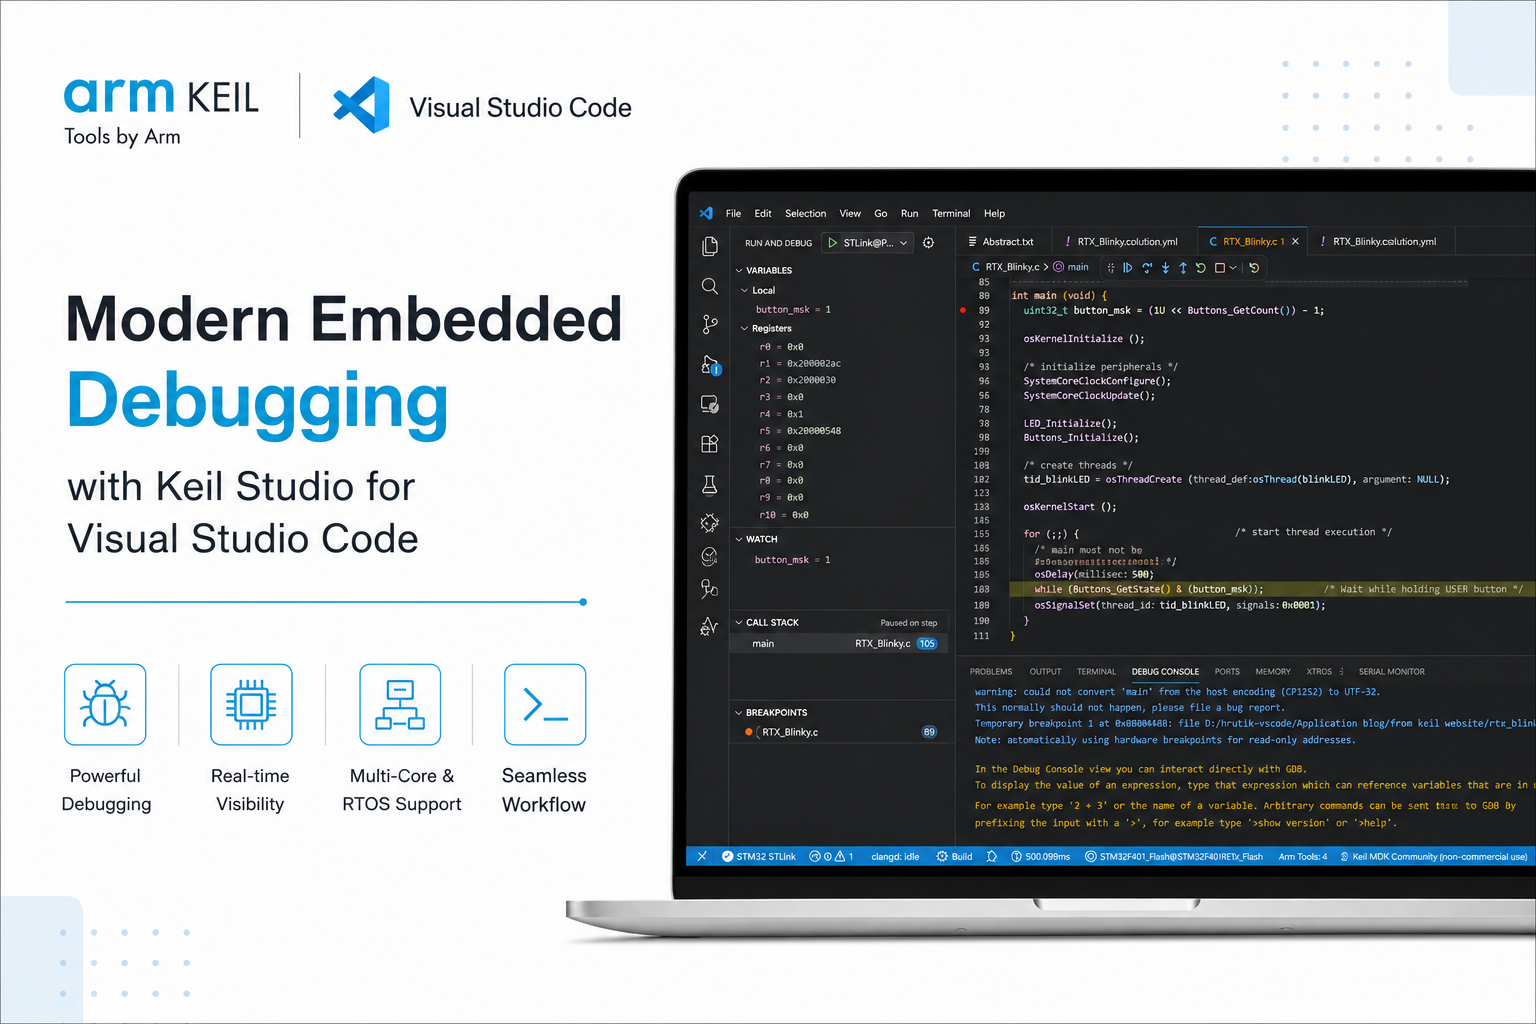
Modern Embedded Debugging with Keil Studio for Visual Studio Code
Visual Studio Code has rapidly become a preferred development environment for embedded software, and many engineering teams are now looking beyond editing and building firmware. The Arm Keil Studio extensions bring professional embedded debugging directly into VS Code, allowing developers to build, flash, and debug firmware from a single workspace while continuing to use familiar Keil tooling. For teams already using Keil uVision, supported projects can be imported as CMSIS Solutions, providing a practical path toward adopting Visual Studio Code without sacrificing the debugging experience many developers already rely on. Once a project is built, supported debug probes such as ST-LINK, CMSIS-DAP, and J-Link are automatically detected, allowing firmware to be downloaded and debugged directly from the editor. The integrated Run and Debug (1) view brings together everything required during a debug session. Developers can inspect local and global variables, monitor custom expressions through the Watch window, review the current execution path using the Call Stack, and manage active breakpoints without switching between multiple tools. For RTOS-based applications, thread-aware debugging also provides visibility into active tasks, making it easier to understand scheduling and runtime execution. The Debug Toolbar (2) provides quick access to the controls used throughout a debug session, including Continue, Pause, Step Over, Step Into, Step Out, Restart, and Disconnect, allowing developers to move through program execution with precision while investigating firmware behavior. The Trace and Live View (3) extends the debugging experience by providing access to Live Watch, Component Viewer, and Core Peripherals from a single workspace. Live Watch continuously updates selected variables during execution, while the peripheral views provide direct access to hardware registers, making it easier to correlate firmware behavior with the underlying hardware. The integrated timing indicator (4) provides execution timing information during a debug session, helping developers monitor elapsed execution time while validating time-sensitive firmware behavior. Meanwhile, the Debug Console (5) enables direct interaction with the underlying GDB session, allowing expressions to be evaluated, debugger commands to be executed, and diagnostic information to be reviewed without leaving Visual Studio Code. Beyond the primary debugging workspace, the Keil debugger also provides several embedded-specific views that simplify firmware analysis. Peripheral View allows developers to inspect MCU peripheral registers in real time, while Memory Inspector supports configurable memory layouts, address navigation, multiple display formats, and direct memory editing when required. Additional tools such as Serial Monitor and Live Watch provide continuous visibility into UART output and application variables, allowing software behavior to be observed alongside hardware state during development. Beyond the standard debugging workflow, the Keil Studio debugger also supports Multi-Core Debugging and RTOS Views. Multi-Core Debugging enables developers to work with multiple processor cores from a single debug session, while RTOS Views provide insight into running threads, priorities, stack usage, and task states for supported real-time operating systems. As Visual Studio Code continues to become the IDE of choice for embedded software development, debugging no longer needs to remain tied to traditional IDEs. The Keil Studio extensions combine a modern development experience with familiar Keil debugging capabilities, allowing embedded developers to adopt a modern workflow without compromising the tools they depend on.
Learn more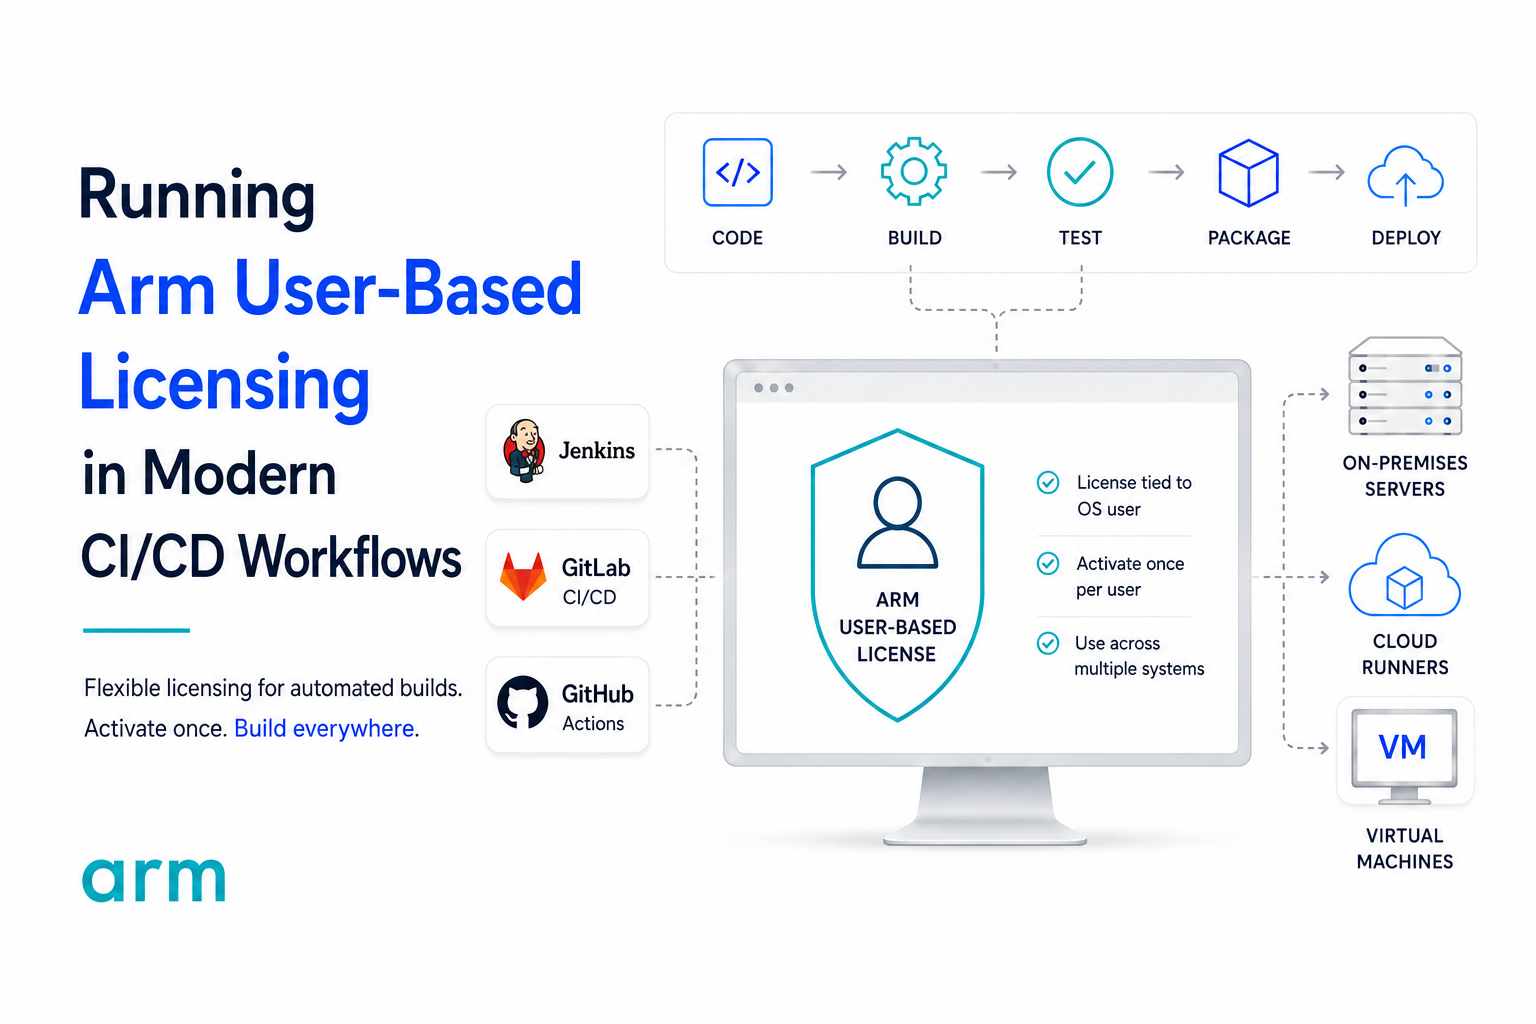
Running Arm User-Based Licensing in Modern CI/CD Workflows
Modern embedded software development no longer ends at a successful local build. Firmware is now continuously compiled, tested, analyzed, and packaged through automated pipelines running on Jenkins, GitHub Actions, GitLab CI, Azure DevOps, and dedicated build servers. While these environments simplify software delivery, they also introduce a practical question for many engineering teams: How should commercial embedded development tools be licensed within an automated build environment? Unlike traditional node-locked licensing, Arm User-Based Licensing (UBL) associates the license with the operating system user executing the Arm development tools rather than a specific machine. This model fits naturally into modern CI/CD infrastructure where build servers, virtual machines, and cloud runners are regularly created, replaced, or scaled without requiring licensing to be tied to individual hardware. A common deployment pattern is to provision a dedicated Windows build runner using a service account such as jenkins, builduser, or gitlab-runner. The UBL license is activated once under that operating system account, allowing every pipeline executed by the same user to access the licensed Arm Compiler or Keil MDK installation without requiring interactive activation during each build. This separation between the CI platform and the licensing mechanism is important. GitHub Actions, Jenkins, or GitLab simply schedule the build; the Arm development tools validate the licensed operating system user at runtime. Once the environment has been provisioned, the licensing process becomes transparent to the pipeline itself, allowing engineering teams to focus on build automation rather than license management. Containerized environments introduce another consideration. UBL identifies the effective operating system username inside the container rather than the Docker host. If a build container executes as root, the licensing system also identifies the user as root. For dedicated CI runners this is a supported deployment model, provided the license is activated for that shared build account. For developer-specific containers, Arm recommends using individual usernames so each engineer's license remains associated with their own environment rather than every user appearing as root. Many engineering organizations also maintain products developed with older Arm and Keil toolchains while introducing modern CI practices. Rather than maintaining separate licensing strategies, Professional UBL licenses can generate compatible node-locked licenses for supported legacy tools including Arm Compiler 5, PK51, PK166, and DK251. Arm also provides unattended installation methods together with command-line licensing utilities, allowing legacy projects to be provisioned automatically as part of a build server image or virtual machine deployment instead of requiring manual IDE configuration. As build infrastructure grows, another common question is whether every virtual machine requires its own license. In practice, the answer depends on how the build environment is deployed. Because UBL licenses the operating system user rather than the hardware, organizations commonly create dedicated build identities that can be reused across multiple build servers and virtual machines. For larger deployments, environments with restricted internet connectivity, or enterprise-scale infrastructure, Arm additionally supports Proxy Activation and Local License Server (LLS) workflows to simplify license management while reducing repetitive online activation requests. For teams designing reproducible CI infrastructure, Arm also recommends automating the provisioning process. Installing the required toolchain version, activating the build account once, and scripting the remaining environment configuration allows new build runners to be deployed consistently across physical servers, virtual machines, or cloud-hosted infrastructure. This approach minimizes manual configuration while ensuring every runner behaves identically, an important requirement for deterministic embedded software builds. User-Based Licensing is ultimately designed to complement modern embedded software development practices rather than constrain them. Whether firmware is being compiled on a local build server, a virtual machine, or a cloud-hosted CI runner, UBL provides a licensing model that aligns with automated software delivery while remaining compatible with both current Arm development tools and many existing legacy projects. As engineering organizations continue investing in DevOps and continuous integration, licensing becomes another component of the build infrastructure one that can be provisioned, automated, and managed alongside the rest of the development environment rather than treated as a separate administrative task. If you'd like to explore specific deployment scenarios in greater detail, Arm provides several excellent technical articles covering User-Based Licensing in automated development environments. Further Reading from Arm Documentation: Legacy Keil tools installation and automating UBL registration for CI environments (GitHub Actions, GitLab Runners, and build servers) Running Keil MDK build tools in Windows Docker containers, including supported configurations, limitations, and licensing considerations Understanding User-Based Licensing (UBL) behavior in Docker containers running as root, including licensing implications and recommended deployment practices If you'd like to discuss your CI/CD environment, migration strategy, or User-Based Licensing deployment, feel free to reach out Hrutik Champaneri at hrutik.champaneri@joraltechnologies.com
Learn more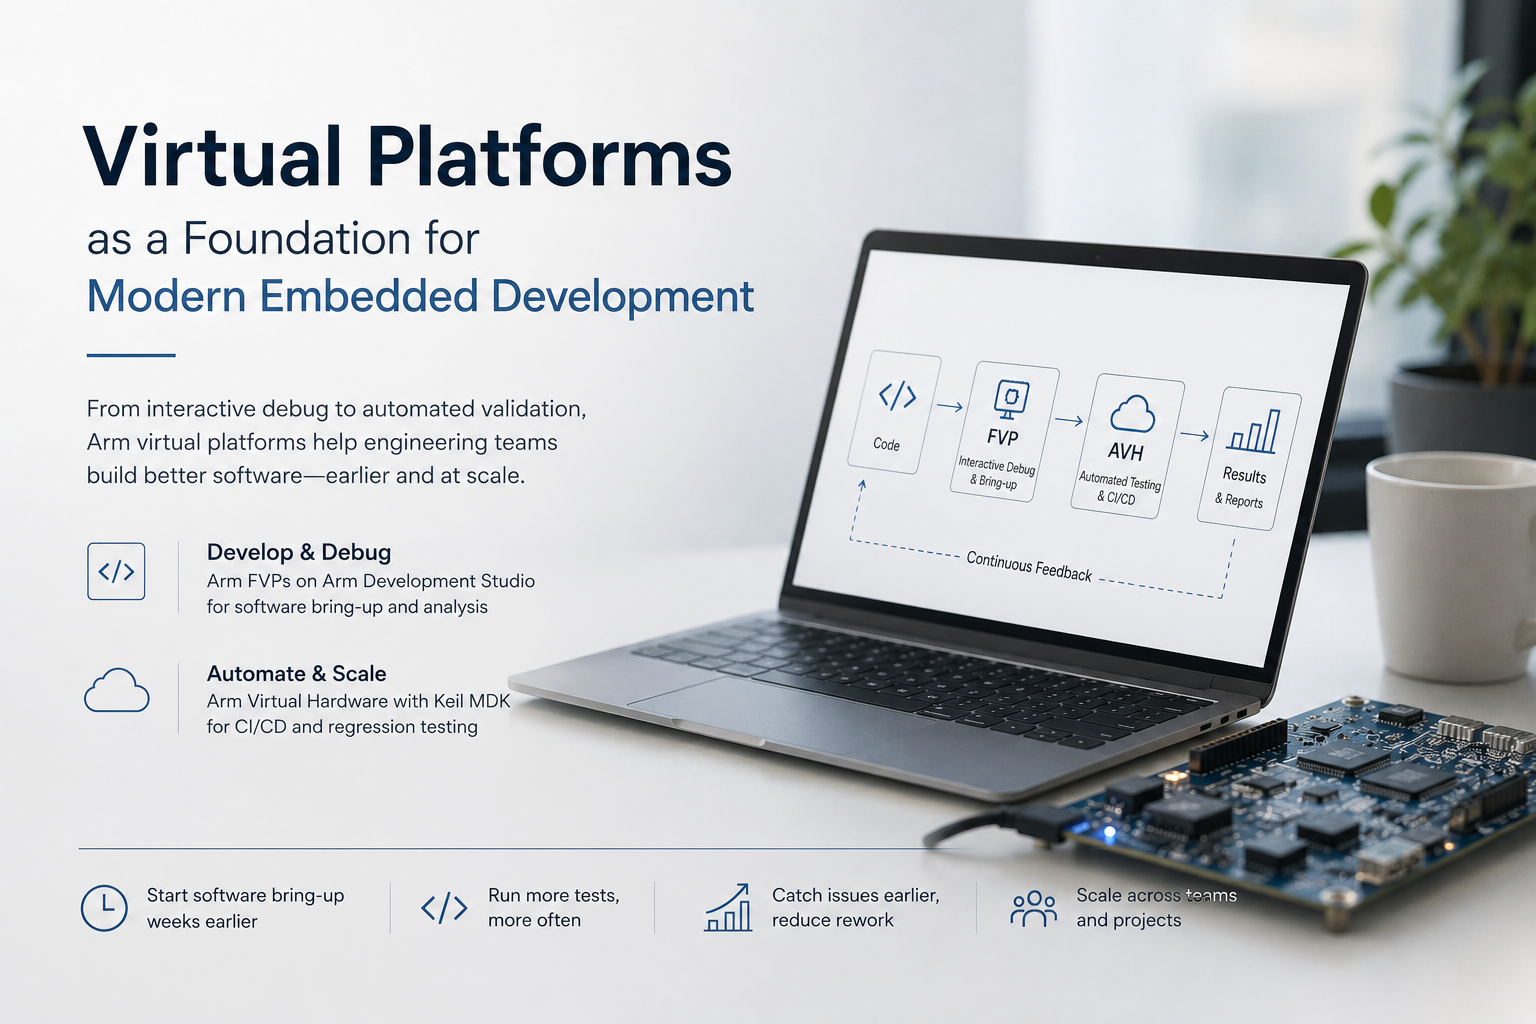
Virtual Platforms as a Foundation for Modern Embedded Development
Modern embedded software development is no longer limited to writing code and waiting for a physical target. As engineering teams adopt CI/CD pipelines, distributed development, and parallel hardware-software workflows, virtual platforms have become an increasingly important part of the embedded software lifecycle. Rather than simply replacing physical hardware, virtual platforms allow software bring-up, debugging, regression testing, and continuous validation to begin earlier while providing a repeatable and scalable execution environment. At the core of these solutions is Arm Fast Models, the simulation technology used to build functionally accurate virtual representations of Arm-based systems. Fixed Virtual Platforms (FVPs) are ready-to-run virtual systems built using Fast Models, providing software developers with complete simulation environments for debugging and software bring-up. Arm Virtual Hardware (AVH) builds upon these virtual platforms by integrating them into a broader ecosystem that supports cloud execution, CI/CD pipelines, automation, and scalable software validation. For Cortex-M software development, Arm Virtual Hardware, available with Keil MDK Professional, enables engineering teams to execute software in virtual environments without relying on physical evaluation boards. Instead of maintaining dedicated hardware for every developer or CI server, teams can automatically build, execute, and validate firmware locally or in cloud-based pipelines. This allows more frequent regression testing, faster feedback on every code change, and better utilization of engineering resources while reducing dependence on shared development hardware. For more complex Cortex-A, Cortex-R, and system-level software development, Fixed Virtual Platforms (FVPs) available with Arm Development Studio provide functionally accurate models for software bring-up and interactive debugging. Developers can inspect memory, debug drivers, validate boot sequences, and analyze software behavior using familiar Arm Development Studio tools, allowing much of the early integration effort to begin in a virtual environment before transitioning to physical validation. Although they are often mentioned together, AVH and FVPs are designed for different purposes. FVPs provide the virtual targets that developers use for software development and debugging, while AVH extends those capabilities into a scalable development ecosystem by integrating virtual targets with cloud infrastructure, DevOps workflows, and CI/CD automation. Rather than competing technologies, they complement one another one focuses on interactive software development, while the other enables automated software validation at scale. While Arm Development Studio includes a broad range of pre-built FVPs, organizations developing custom silicon can use the Arm Fast Models Library and System Generator (SG_Simulator) to create platform-specific virtual models, allowing software bring-up and validation to begin on architectures that do not yet exist as standard reference platforms. As embedded systems continue to increase in complexity, virtual platforms are becoming more than just simulation tools. They are helping engineering teams improve software quality, increase testing frequency, reduce hardware dependencies, and build modern embedded development workflows that scale from a developer's desktop to enterprise CI/CD environments. Interested in learning more about Arm Virtual Hardware, Fixed Virtual Platforms (FVPs), or Arm Development Studio? Contact Hrutik Champaneri at hrutik.champaneri@joraltechnologies.com. Watch our Arm Virtual Hardware video here
Learn more
QA-MISRA 26.04: Faster Analysis, Smarter Reporting, Greater Flexibility
The new release delivers significant improvements in performance, reporting accuracy, and workflow flexibility for teams developing safety- and business-critical software. It introduces ...
Learn more
Cantata 26.04: Bringing AI-Assisted Testing into the Verification Workflow
The new release introduces new AI-assisted testing capabilities, enhanced automation, and greater flexibility for teams developing safety-critical C and C++ software. Highlights include...
Learn more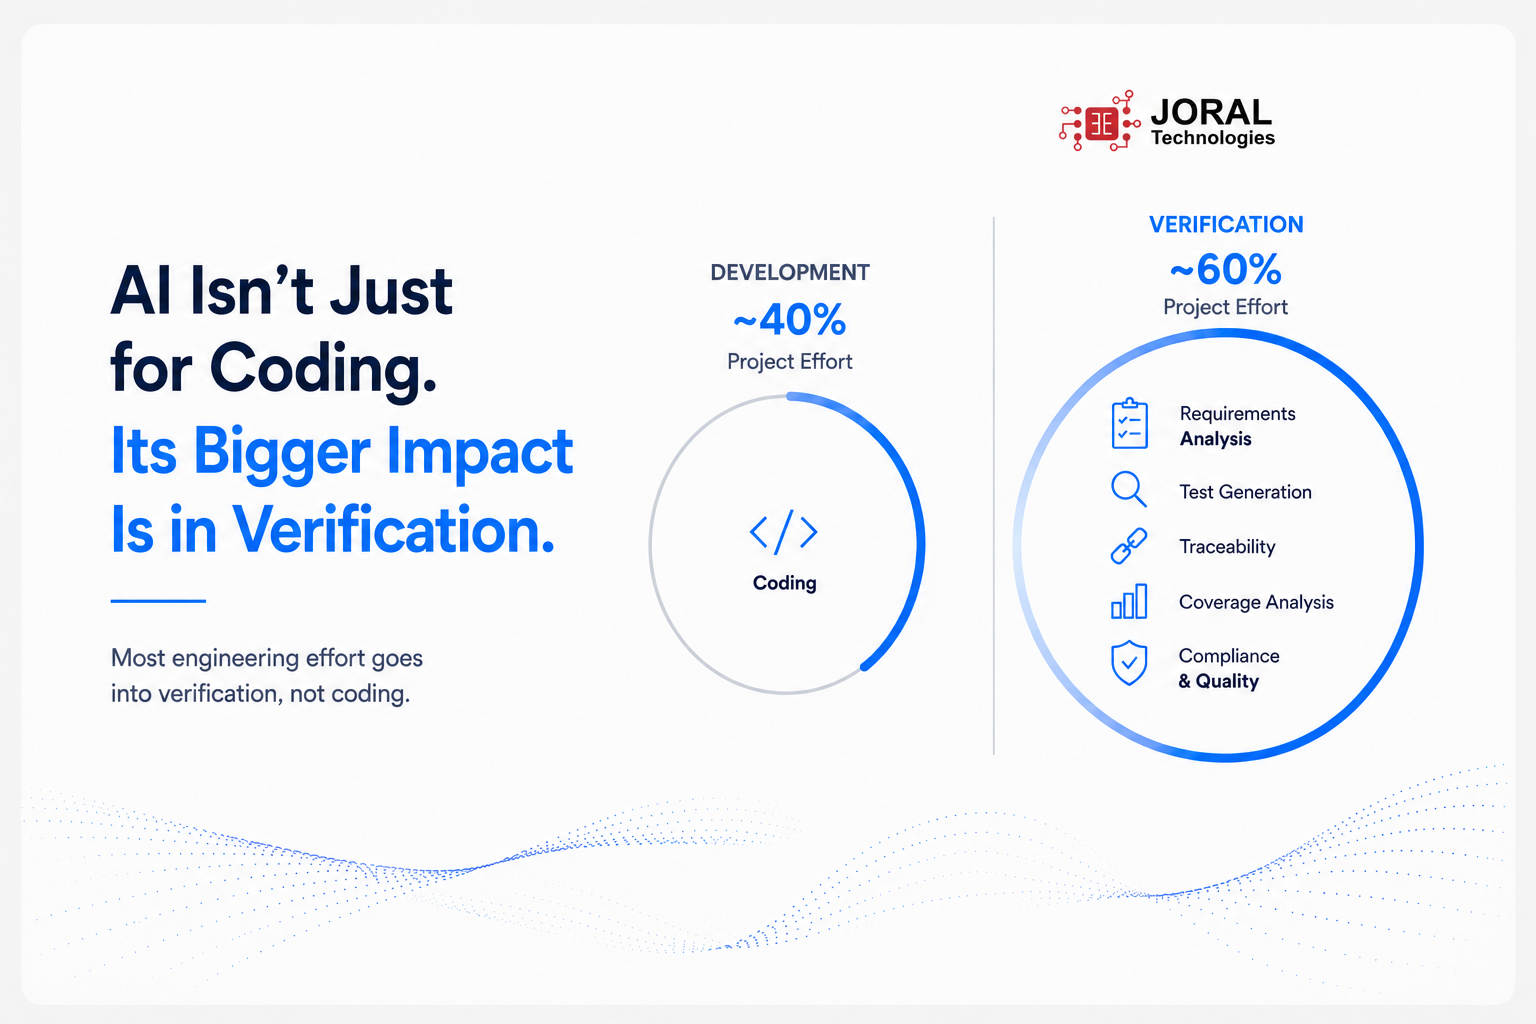
Why AI May Have a Bigger Impact on Embedded Verification Than Embedded Development
Much of the discussion surrounding AI in embedded systems has focused on one question: Can AI write embedded software? While AI assisted code generation continues to evolve, many engineering organizations are discovering that AI's greatest opportunity may lie elsewhere in reducing the growing effort associated with software verification. In modern embedded projects, activities such as requirements analysis, test development, traceability management, coverage analysis, and compliance verification can consume 50–70% of the overall software development effort. As products become more complex and schedules become tighter, improving verification efficiency has become just as important as accelerating software development. Rather than replacing embedded engineers, AI is helping teams automate repetitive tasks so they can spend more time solving engineering problems. One of the earliest opportunities for AI is during requirements analysis. Large embedded projects often contain hundreds or even thousands of requirements that must be reviewed for ambiguity, consistency, completeness, and traceability. Instead of starting with a manual review, teams can use Developair to automatically identify ambiguous wording, inconsistent terminology, missing acceptance criteria, and traceability gaps. Engineers remain in control, while AI provides a valuable first pass that allows reviews to focus on engineering decisions rather than document cleanup. Verification effort continues to increase once software reaches testing. Creating and maintaining unit tests, measuring coverage, and updating regression suites after requirement changes can quickly become one of the most time consuming phases of development. AI can help generate an initial set of test scenarios directly from the requirements, which can then be imported into Cantata for execution, refinement, and automated regression testing. Instead of starting from scratch, teams begin with a solid baseline that can be expanded and validated using statement, branch, and MC/DC coverage. Depending on project complexity and process maturity, automating parts of this workflow can reduce verification effort by 20–40% while improving consistency across the test suite. AI generated code and tests still require engineering validation. Rather than replacing established verification practices, AI is becoming another tool within the embedded workflow helping engineers improve traceability, reduce repetitive effort, and deliver higher-quality software with greater confidence. Interested in modernizing your embedded software verification workflow? Contact Hrutik Champaneri at hrutik.champaneri@joraltechnologies.com to learn more and reserve your spot for our upcoming DevelopAIR and Cantata webinar. Watch the video below to explore the AI features available in Cantata and the tasks you can accomplish using Claude AI.
Learn more
EMBEDDED IS EVERYWHERE
PRODUCTS
Manufacturers
Resource center