
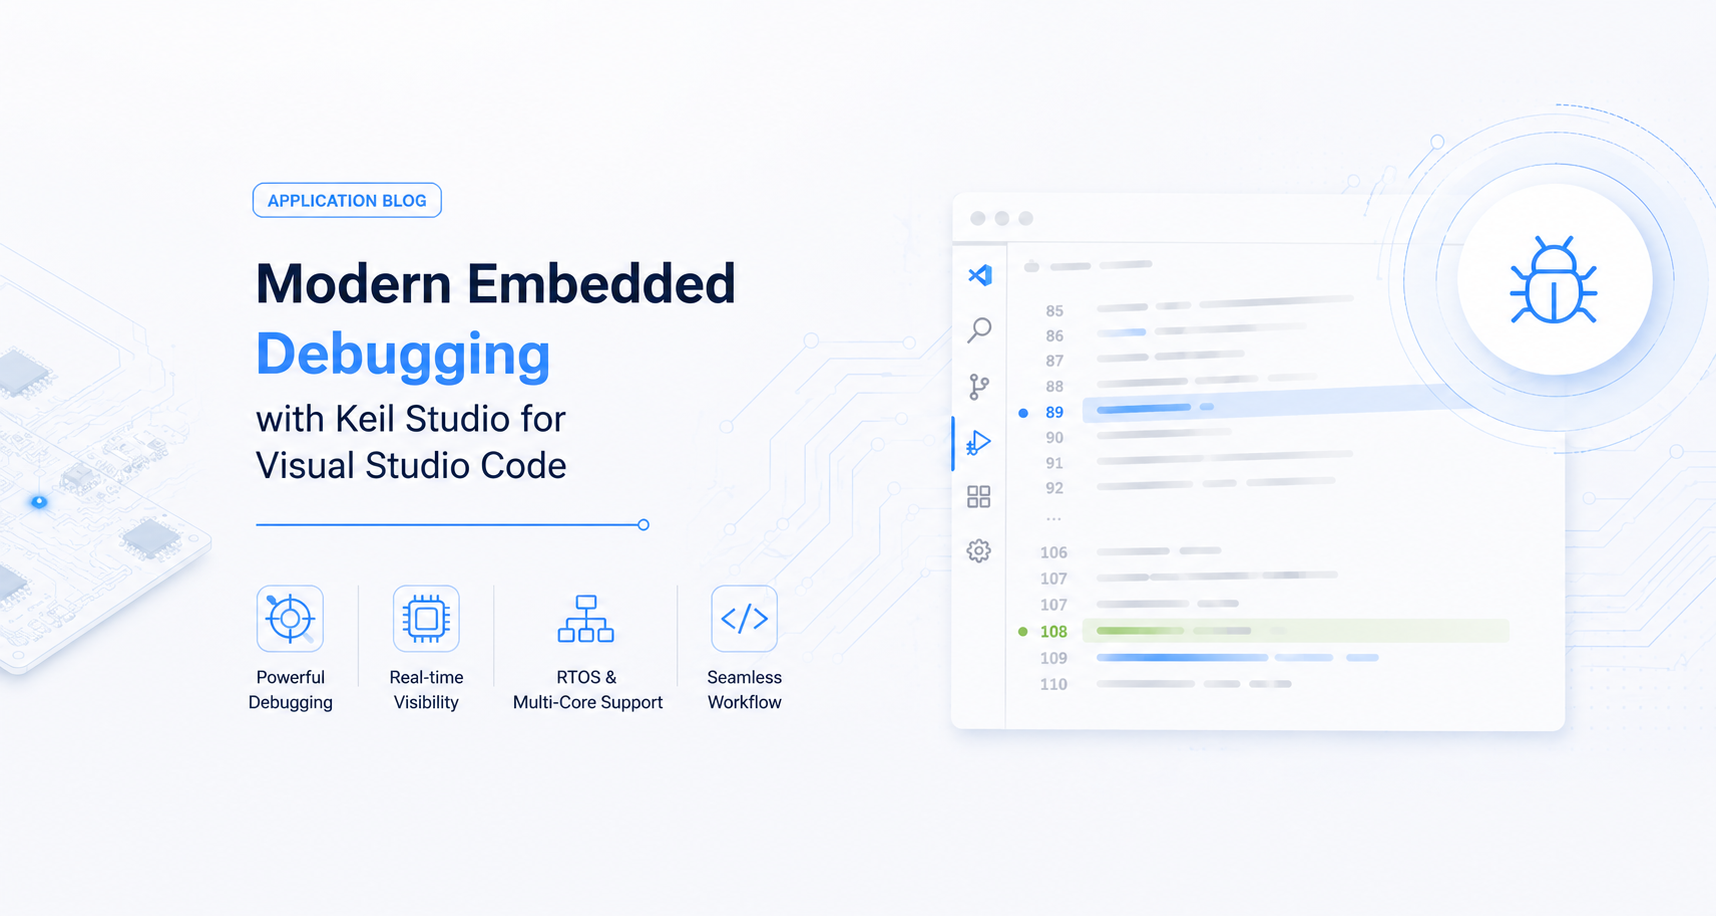
Modern Embedded Debugging with Keil Studio for Visual Studio Code
Visual Studio Code has rapidly become a preferred development environment for embedded software, and many engineering teams are now looking beyond editing and building firmware. The Arm Keil Studio extensions bring professional embedded debugging directly into VS Code, allowing developers to build, flash, and debug firmware from a single workspace while continuing to use familiar Keil tooling.
For teams already using Keil uVision, supported projects can be imported as CMSIS Solutions, providing a practical path toward adopting Visual Studio Code without sacrificing the debugging experience many developers already rely on. Once a project is built, supported debug probes such as ST-LINK, CMSIS-DAP, and J-Link are automatically detected, allowing firmware to be downloaded and debugged directly from the editor.

The integrated Run and Debug (1) view brings together everything required during a debug session. Developers can inspect local and global variables, monitor custom expressions through the Watch window, review the current execution path using the Call Stack, and manage active breakpoints without switching between multiple tools. For RTOS-based applications, thread-aware debugging also provides visibility into active tasks, making it easier to understand scheduling and runtime execution.
The Debug Toolbar (2) provides quick access to the controls used throughout a debug session, including Continue, Pause, Step Over, Step Into, Step Out, Restart, and Disconnect, allowing developers to move through program execution with precision while investigating firmware behavior.
The Trace and Live View (3) extends the debugging experience by providing access to Live Watch, Component Viewer, and Core Peripherals from a single workspace. Live Watch continuously updates selected variables during execution, while the peripheral views provide direct access to hardware registers, making it easier to correlate firmware behavior with the underlying hardware.
The integrated timing indicator (4) provides execution timing information during a debug session, helping developers monitor elapsed execution time while validating time-sensitive firmware behavior. Meanwhile, the Debug Console (5) enables direct interaction with the underlying GDB session, allowing expressions to be evaluated, debugger commands to be executed, and diagnostic information to be reviewed without leaving Visual Studio Code.

Beyond the primary debugging workspace, the Keil debugger also provides several embedded-specific views that simplify firmware analysis. Peripheral View allows developers to inspect MCU peripheral registers in real time, while Memory Inspector supports configurable memory layouts, address navigation, multiple display formats, and direct memory editing when required. Additional tools such as Serial Monitor and Live Watch provide continuous visibility into UART output and application variables, allowing software behavior to be observed alongside hardware state during development.
Beyond the standard debugging workflow, the Keil Studio debugger also supports Multi-Core Debugging and RTOS Views. Multi-Core Debugging enables developers to work with multiple processor cores from a single debug session, while RTOS Views provide insight into running threads, priorities, stack usage, and task states for supported real-time operating systems.
As Visual Studio Code continues to become the IDE of choice for embedded software development, debugging no longer needs to remain tied to traditional IDEs. The Keil Studio extensions combine a modern development experience with familiar Keil debugging capabilities, allowing embedded developers to adopt a modern workflow without compromising the tools they depend on.
RELATED NEWS
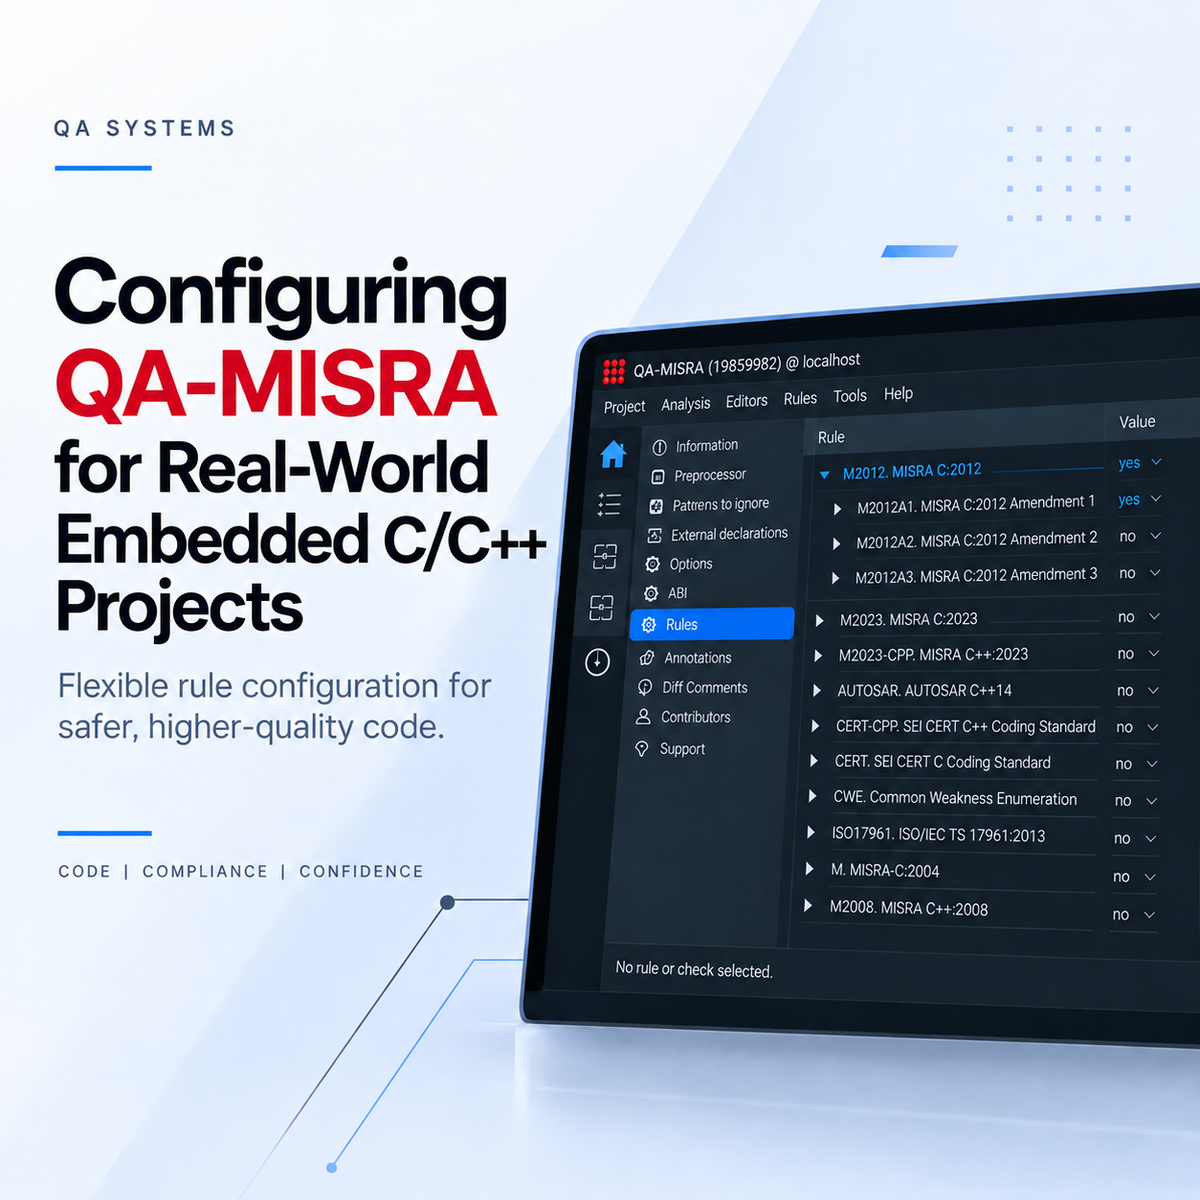
Configuring QA-MISRA for Real-World Embedded C/C++ Projects
Getting QA-MISRA running is only the first part of the setup. For an actual embedded project, you will usually need to decide which coding rules should be checked, how compiler-specific code sho[...]
Read more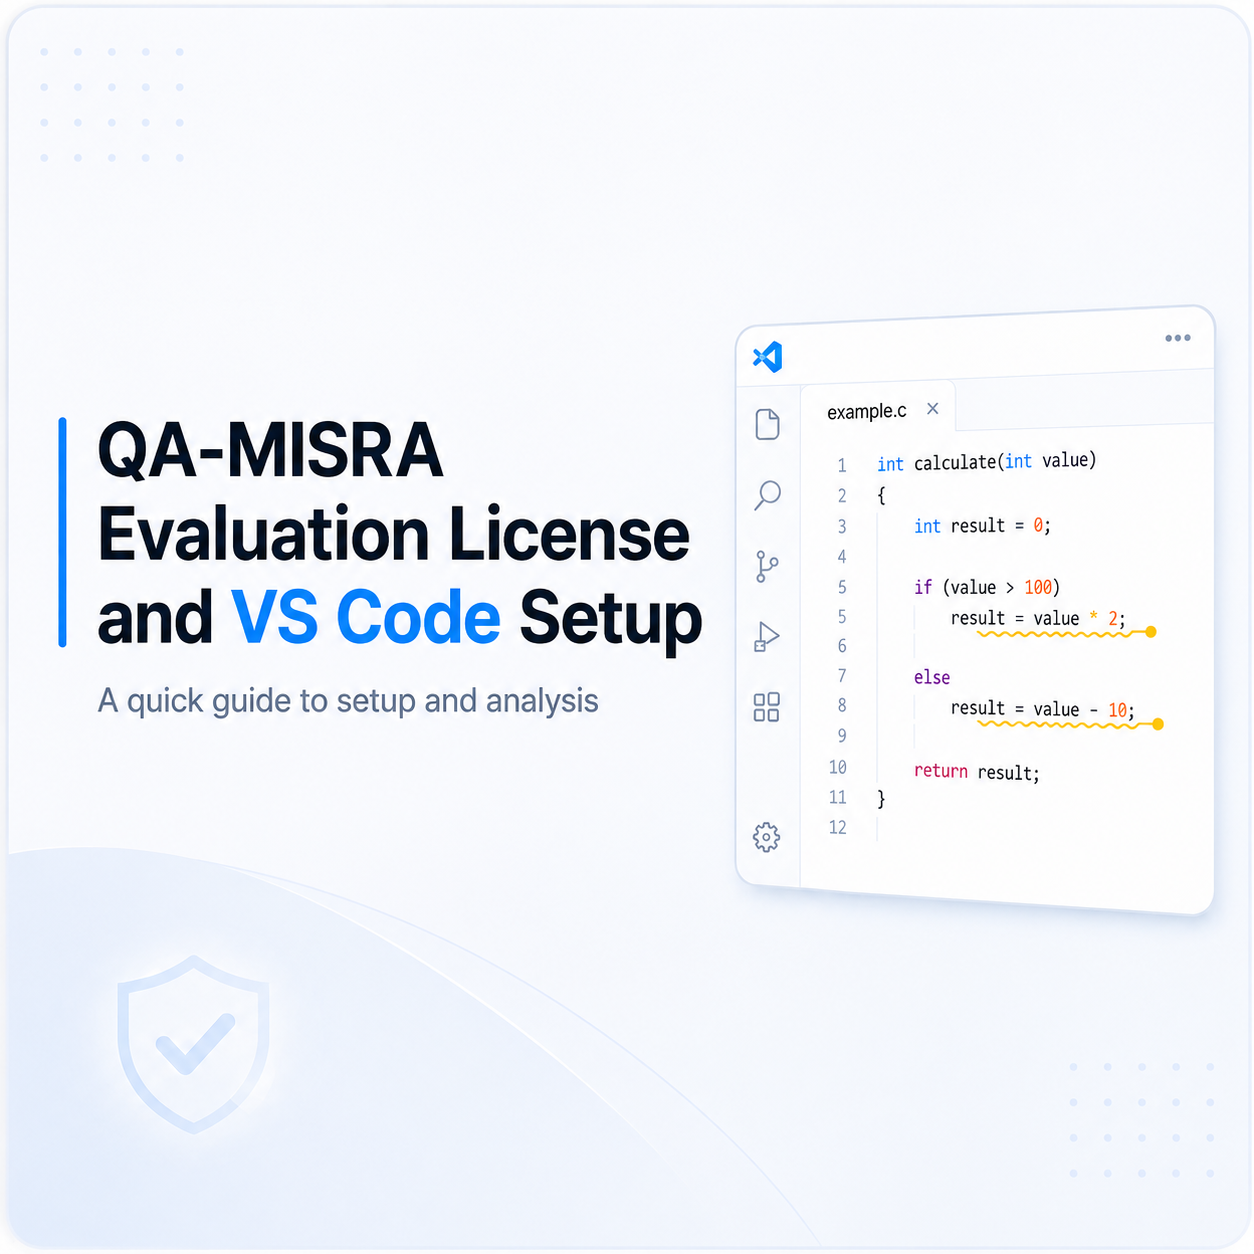
Setting Up a QA-MISRA Evaluation License and VS Code Extension
The following steps explain how to activate a QA-MISRA evaluation license, configure the local server, install the QA-MISRA extension in Visual Studio Code, and run an example analysis. 1. Requ[...]
Read more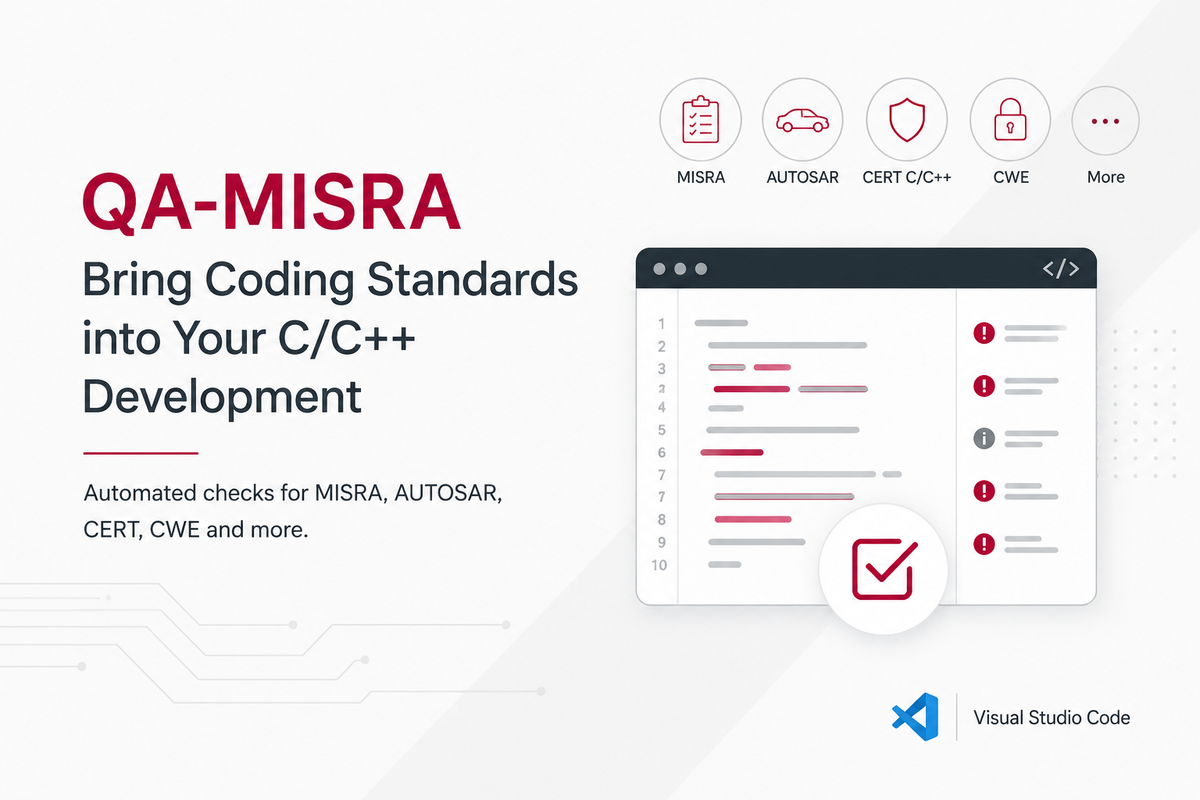
Using QA-MISRA to Bring Coding Standards into C/C++ Development
In embedded and safety-critical software, coding standards help reduce risky language behaviour, improve consistency, and make software easier to review and verify. This is especially important i[...]
Read more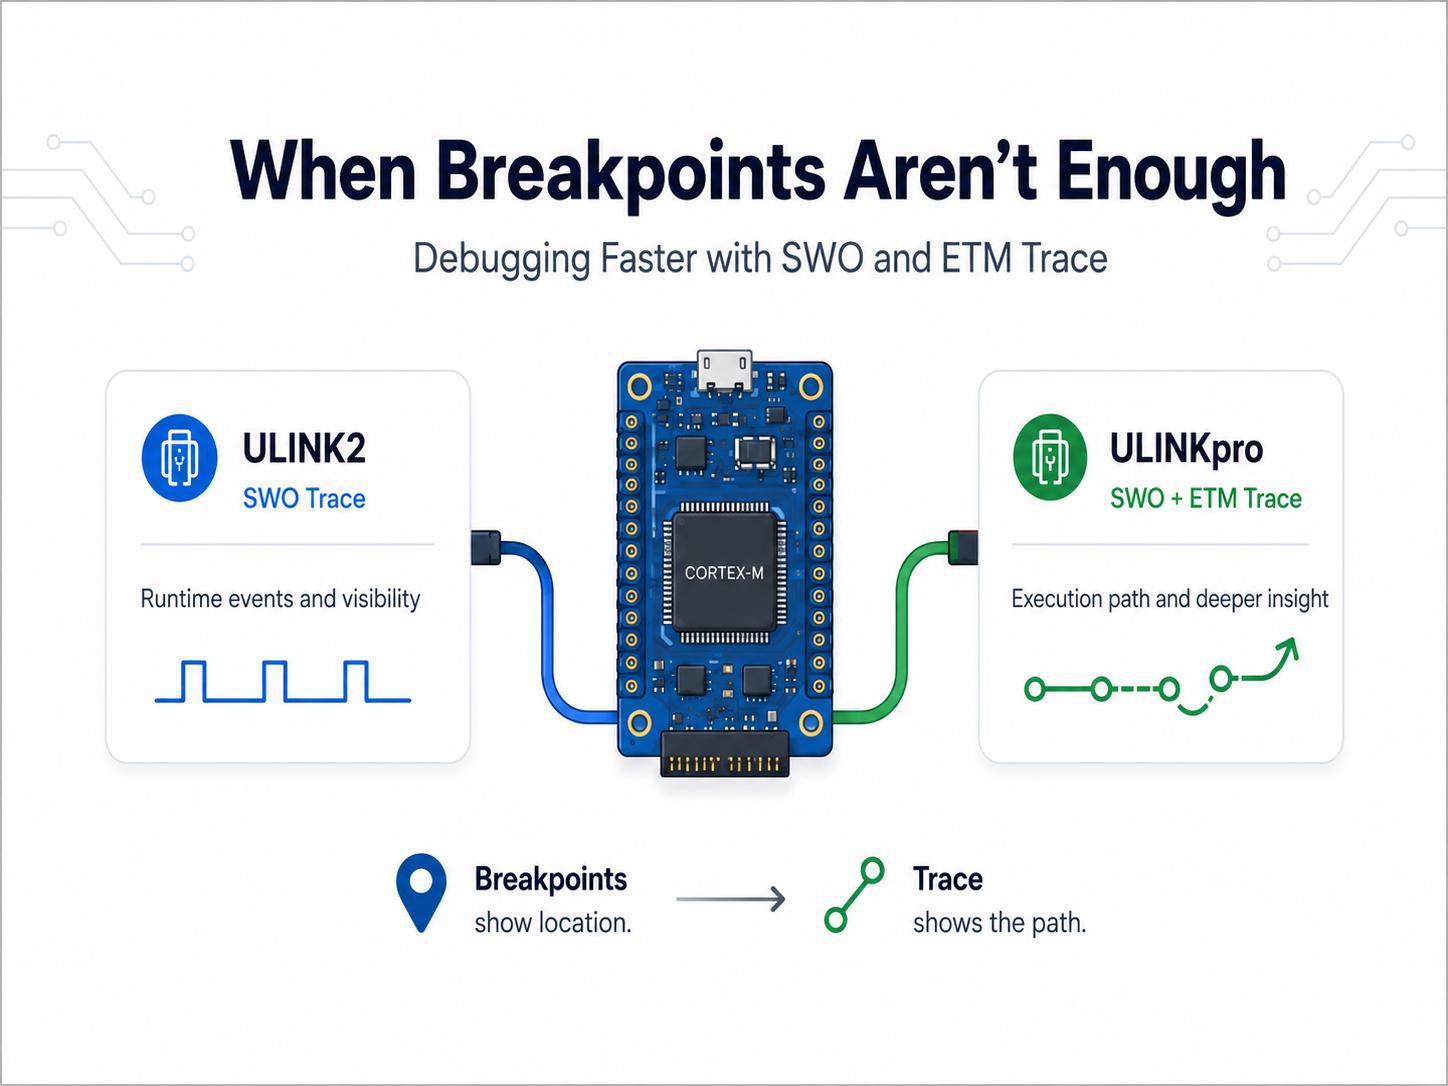
When Breakpoints Aren’t Enough: Debugging Faster with ULINKpro Trace
Most embedded developers are familiar with the usual debugging cycle: set a breakpoint, stop the processor, inspect the problem, make a change, and try again. That works well until the problem [...]
Read more
How Static Analysis Supports DO-178C Verification
Developing software for airborne systems requires strong verification evidence, especially for higher-criticality applications. DO-178C defines objectives for airborne software development and ve[...]
Read more
EMBEDDED IS EVERYWHERE

PRODUCTS
Manufacturers
Resource center