
Setting Up a QA-MISRA Evaluation License and VS Code Extension
The following steps explain how to activate a QA-MISRA evaluation license, configure the local server, install the QA-MISRA extension in Visual Studio Code, and run an example analysis.
1. Request the QA-MISRA Evaluation License
Request an evaluation license for QA-MISRA.
After submitting the request, you will receive an email asking you to accept the End User License Agreement (EULA). Once the EULA is accepted, you will receive another email containing:
- The evaluation license file
- A portal link to download the QA-MISRA installation package
2. Install QA-MISRA
Download the QA-MISRA installation package using the link provided in the email and install it on your system.
3. Start the QA-MISRA Local Server
Open the QA-MISRA Server Controller.
Click Manage Local Server, then select Start Server from the drop-down menu.

4. Log In to the Local Server
When prompted for login credentials, use the default credentials:
Username: admin
Password: admin
After logging in, the Server Controller will display the local server and license information.

5. Add the Evaluation License
In the License section, click the icon on the right-hand side.

In the window that opens:
- Select Evaluation/Node-Locked License from the license menu.
- Under Data, enter or browse to the location of the license file received by email.
- Click OK.
The evaluation license should now appear as active in the Server Controller.

6. Install the QA-MISRA Extension in VS Code
Open Visual Studio Code and go to the Extensions tab.
Click the three-dot menu (...) in the Extensions panel and select Install from VSIX...

Navigate to the QA-MISRA installation directory and open:
share → vscode
Select the available .vsix file and click Install.
Once the installation is complete, the QA-MISRA extension page will appear in VS Code.

7. Open a QA-MISRA Example Project
To verify that QA-MISRA is working correctly, open one of the example projects included with the QA-MISRA installation.
The example folder is available inside the share directory.
Choose the example project you want to analyze and open the folder in VS Code.
8. Check the .dax File
Make sure the required .dax file is available for the example project.
For the provided examples, the .dax file should be located one folder above the source files that you want to analyze.

9. Run and View the QA-MISRA Analysis
Open the desired .c or .cpp source file.
Then open the Output panel in VS Code. The QA-MISRA output will appear here as the source code is analyzed.

10. View MISRA Violations in the Source Code
Once the analysis is running, QA-MISRA highlights detected issues directly in the source code using yellow squiggly lines.
Hover over a highlighted section to view the corresponding ALARM, including information about the coding-standard violation detected by QA-MISRA.

11. Change the Analysis Mode
By default, the QA-MISRA extension is configured to use Single Translation Unit mode. If you want to analyze the complete project, you can change the analysis mode in the VS Code settings.
Go to:
File → Preferences → Settings → Extensions
Under Extensions, select a³ for C/C++ LSP Client.
Find the A3c › Client: Mode setting. Open the drop-down menu and change the mode from single-translation-unit to the full-project analysis mode.

Single Translation Unit vs. Full Project: Single Translation Unit mode analyzes individual source files separately, while full-project mode analyzes the project with a broader view of the code and relationships between multiple source files.
RELATED NEWS
Beyond Code Generation: AI-Assisted Embedded Development with Arm CMSIS
AI coding assistants can generate a UART driver in seconds. But when the output is garbled or an application unexpectedly enters a HardFault handler, the problem may not be obvious from the sourc[...]
Read more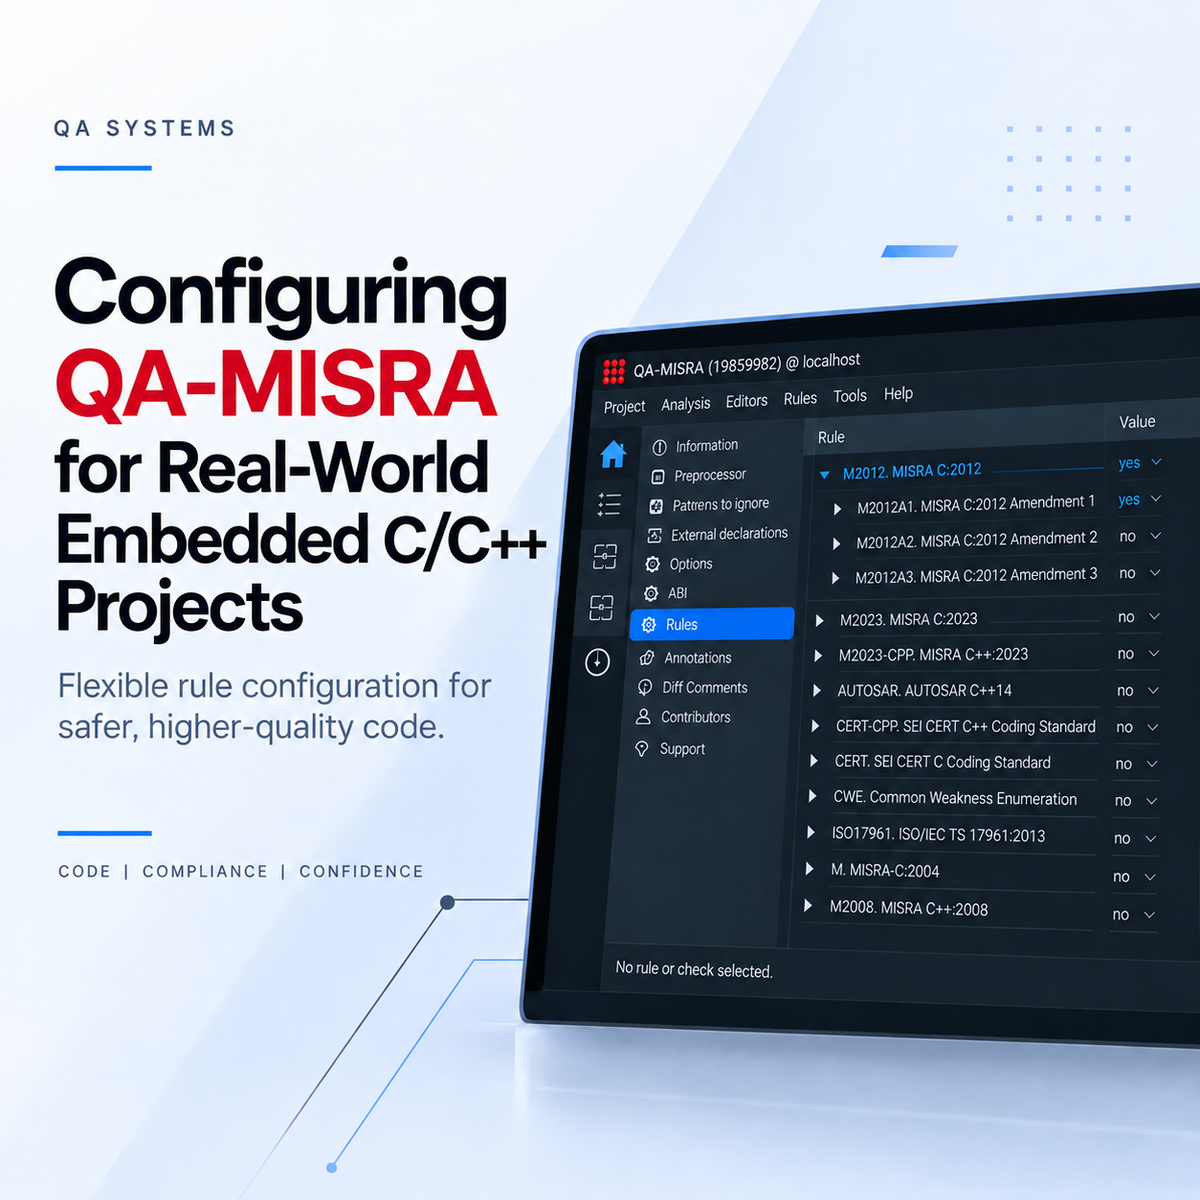
Configuring QA-MISRA for Real-World Embedded C/C++ Projects
Getting QA-MISRA running is only the first part of the setup. For an actual embedded project, you will usually need to decide which coding rules should be checked, how compiler-specific code sho[...]
Read more
Using QA-MISRA to Bring Coding Standards into C/C++ Development
In embedded and safety-critical software, coding standards help reduce risky language behaviour, improve consistency, and make software easier to review and verify. This is especially important i[...]
Read more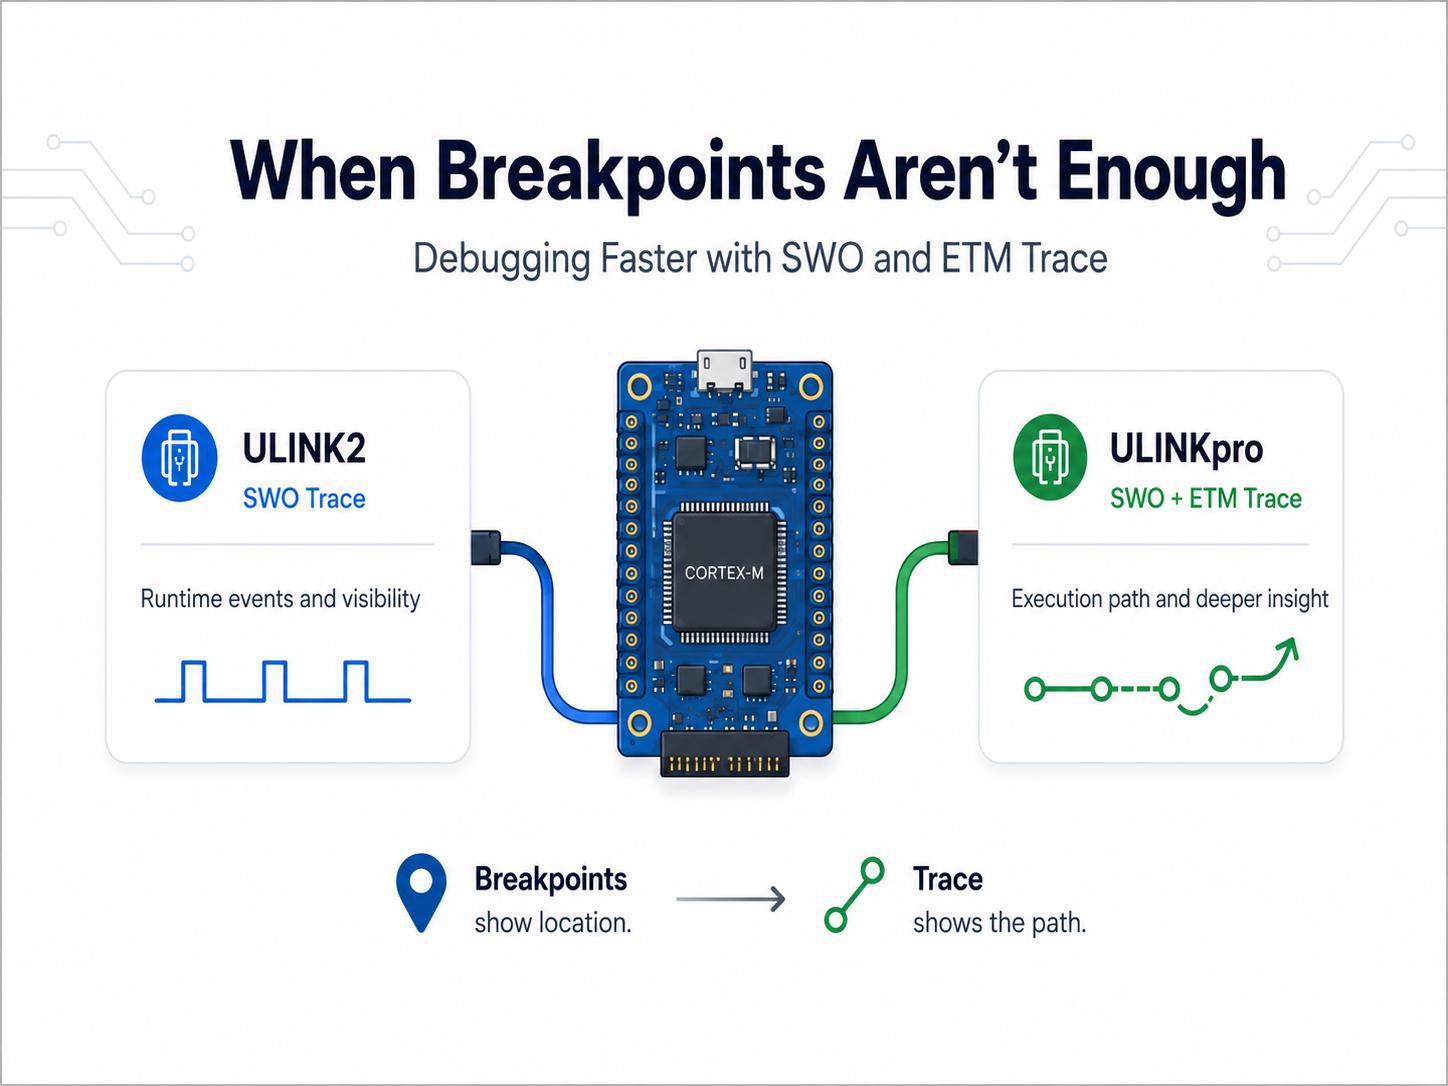
When Breakpoints Aren’t Enough: Debugging Faster with ULINKpro Trace
Most embedded developers are familiar with the usual debugging cycle: set a breakpoint, stop the processor, inspect the problem, make a change, and try again. That works well until the problem [...]
Read more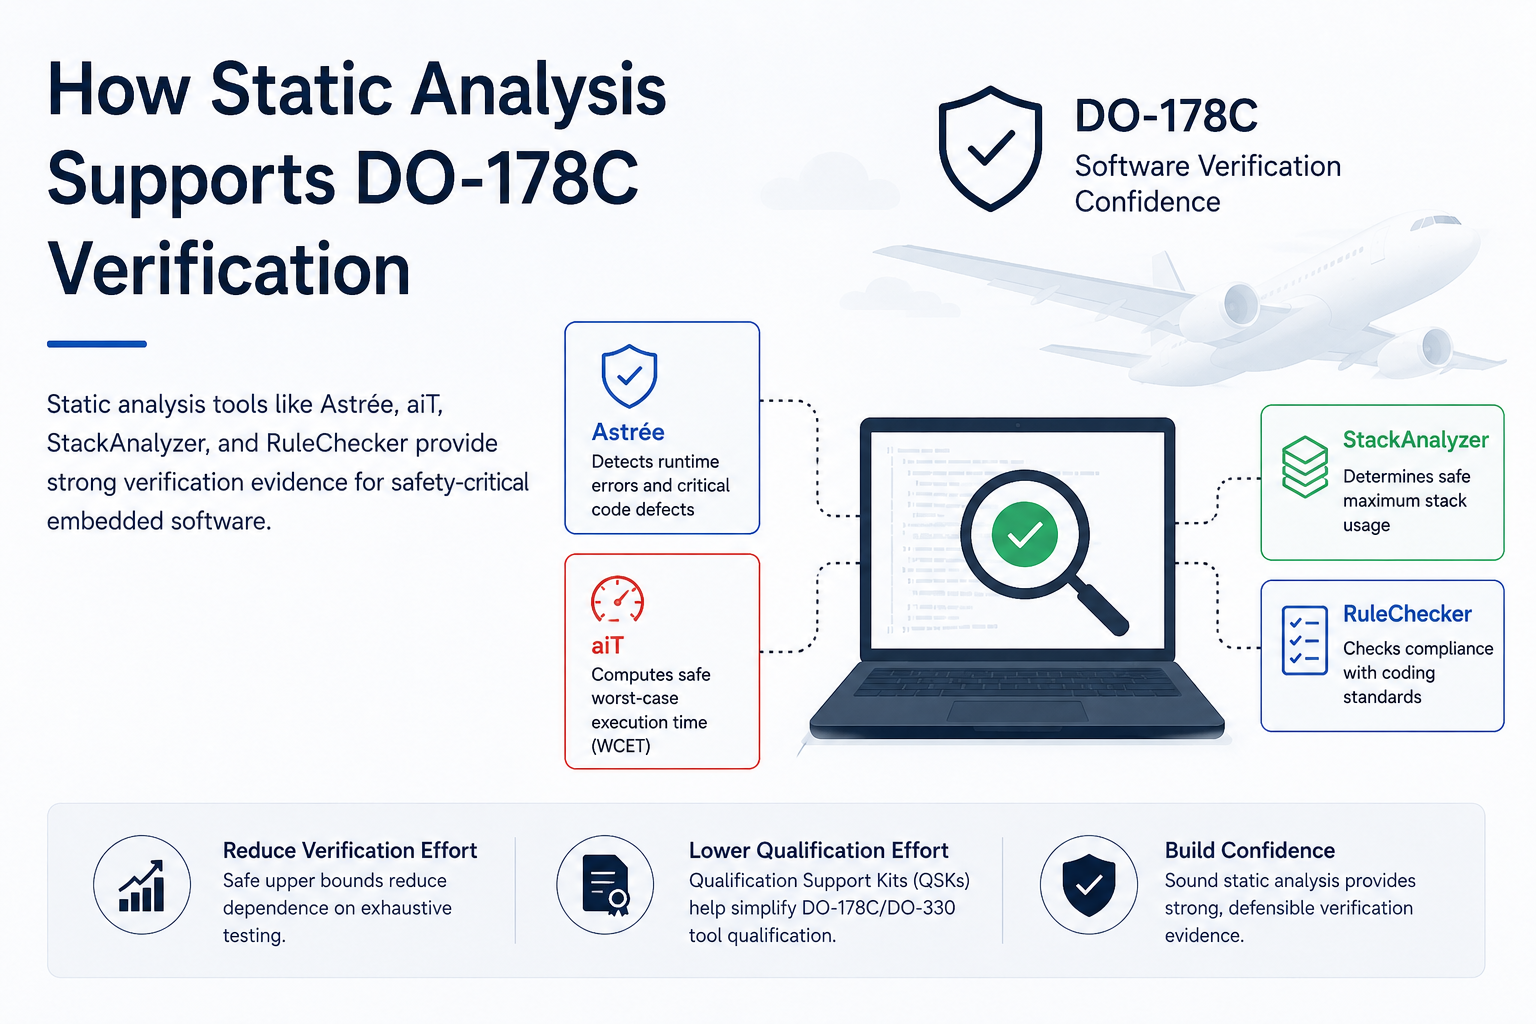
How Static Analysis Supports DO-178C Verification
Developing software for airborne systems requires strong verification evidence, especially for higher-criticality applications. DO-178C defines objectives for airborne software development and ve[...]
Read more
EMBEDDED IS EVERYWHERE

PRODUCTS
Manufacturers
Resource center